29
/
en
AIzaSyAYiBZKx7MnpbEhh9jyipgxe19OcubqV5w
April 1, 2024
158429
Iraq
IRQ
true
2
1
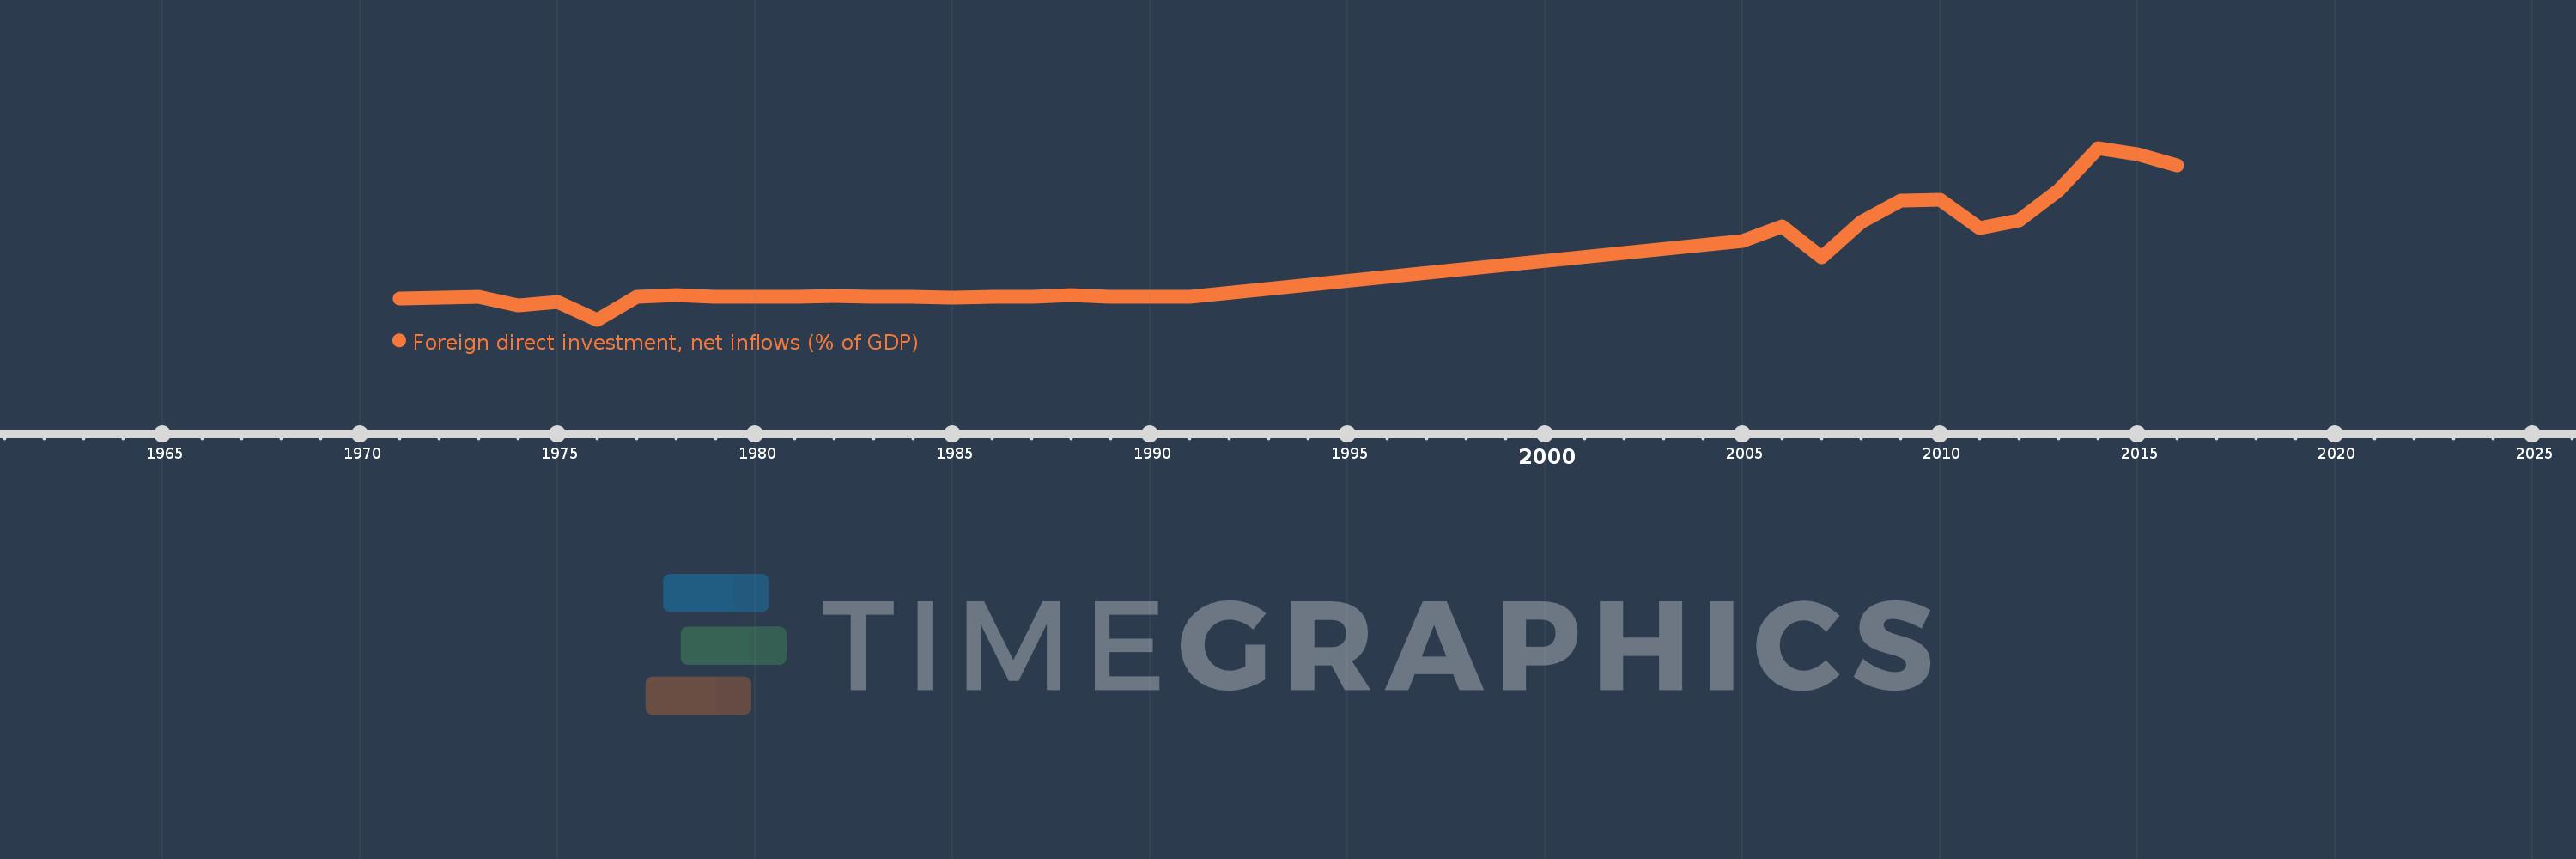
Foreign direct investment, net inflows (% of GDP)
2016,2015,2014,2013,2012,2011,2010,2009,2008,2007,2006,2005,1991,1990,1989,1988,1987,1986,1985,1984,1983,1982,1981,1980,1979,1978,1977,1976,1975,1974,1973,1972,1971
This statistics in other country:
AfghanistanAlbaniaAlgeriaAngolaAntigua and BarbudaArab WorldArgentinaArmeniaArubaAustraliaAustriaAzerbaijanBahamas, TheBahrainBangladeshBarbadosBelarusBelgiumBelizeBeninBermudaBhutanBoliviaBosnia and HerzegovinaBotswanaBrazilBrunei DarussalamBulgariaBurkina FasoBurundiCabo VerdeCambodiaCameroonCanadaCaribbean small statesCayman IslandsCentral African RepublicCentral Europe and the BalticsChadChileChinaColombiaComorosCongo, Dem. Rep.Congo, Rep.Costa RicaCote d'IvoireCroatiaCyprusCzech RepublicDenmarkDjiboutiDominicaDominican RepublicEarly-demographic dividendEast Asia & PacificEast Asia & Pacific (excluding high income)East Asia & Pacific (IDA & IBRD countries)EcuadorEgypt, Arab Rep.El SalvadorEquatorial GuineaEritreaEstoniaEthiopiaEuro areaEurope & Central AsiaEurope & Central Asia (excluding high income)Europe & Central Asia (IDA & IBRD countries)European UnionFijiFinlandFragile and conflict affected situationsFranceFrench PolynesiaGabonGambia, TheGeorgiaGermanyGhanaGreeceGrenadaGuatemalaGuineaGuinea-BissauGuyanaHaitiHeavily indebted poor countries (HIPC)High incomeHondurasHong Kong SAR, ChinaHungaryIBRD onlyIcelandIDA & IBRD totalIDA blendIDA onlyIDA totalIndiaIndonesiaIran, Islamic Rep.IraqIrelandIsraelItalyJamaicaJapanJordanKazakhstanKenyaKiribatiKorea, Rep.KosovoKuwaitKyrgyz RepublicLao PDRLate-demographic dividendLatin America & Caribbean Latin America & Caribbean (excluding high income)Latin America & the Caribbean (IDA & IBRD countries)LatviaLeast developed countries: UN classificationLebanonLesothoLiberiaLibyaLithuaniaLow & middle incomeLow incomeLower middle incomeLuxembourgMacao SAR, ChinaMacedonia, FYRMadagascarMalawiMalaysiaMaldivesMaliMaltaMarshall IslandsMauritaniaMauritiusMexicoMicronesia, Fed. Sts.Middle East & North AfricaMiddle East & North Africa (excluding high income)Middle East & North Africa (IDA & IBRD countries)Middle incomeMoldovaMongoliaMontenegroMoroccoMozambiqueMyanmarNamibiaNauruNepalNetherlandsNew CaledoniaNew ZealandNicaraguaNigerNigeriaNorth AmericaNorwayOECD membersOmanOther small statesPacific island small statesPakistanPalauPanamaPapua New GuineaParaguayPeruPhilippinesPolandPortugalPost-demographic dividendPre-demographic dividendQatarRomaniaRussian FederationRwandaSamoaSao Tome and PrincipeSaudi ArabiaSenegalSerbiaSeychellesSierra LeoneSingaporeSlovak RepublicSloveniaSmall statesSolomon IslandsSomaliaSouth AfricaSouth AsiaSouth Asia (IDA & IBRD)South SudanSpainSri LankaSt. Kitts and NevisSt. LuciaSt. Vincent and the GrenadinesSub-Saharan Africa Sub-Saharan Africa (excluding high income)Sub-Saharan Africa (IDA & IBRD countries)SudanSurinameSwazilandSwedenSwitzerlandSyrian Arab RepublicTajikistanTanzaniaThailandTimor-LesteTogoTongaTrinidad and TobagoTunisiaTurkeyTurkmenistanTuvaluUgandaUkraineUnited Arab EmiratesUnited KingdomUnited StatesUpper middle incomeUruguayUzbekistanVanuatuVenezuela, RBVietnamWest Bank and GazaWorldYemen, Rep.ZambiaZimbabwe Timeline:
This timeline shows a graph from 1971 to 2016 of Iraq. No data until 1970. Number of actual observations by date: 33.
Source name:
World Development Indicators
Source organization:
International Monetary Fund, International Financial Statistics and Balance of Payments databases, World Bank, International Debt Statistics, and World Bank and OECD GDP estimates.
Categories, topics:
Economy & Growth, Financial Sector, Climate Change
Last updated:
apr 23, 2017
Indicators value changes by year
Minimum:
-0.334
jan 1, 1976
At the date of observation
Value
Absolute change
Change from previous value
jan 1, 1971
-0.028
-0.028
0.0%
jan 1, 1972
-0.005
+0.023
-83.21%
jan 1, 1973
-0.002
+0.002
-53.02%
jan 1, 1974
-0.128
-0.125
5.73K%
jan 1, 1975
-0.077
+0.051
-39.9%
jan 1, 1976
-0.334
-0.257
335.32%
jan 1, 1977
0.008
+0.341
-102.28%
jan 1, 1978
0.022
+0.015
191.04%
jan 1, 1979
0.001
-0.021
-94.29%
jan 1, 1980
0.004
+0.003
237.22%
jan 1, 1981
0.003
-0.001
-32.71%
jan 1, 1982
0.011
+0.008
274.27%
jan 1, 1983
0.006
-0.005
-47.01%
jan 1, 1984
0.004
-0.002
-36.26%
jan 1, 1985
-0.01
-0.014
-377.91%
jan 1, 1986
0.001
+0.011
-108.03%
jan 1, 1987
0.004
+0.003
412.28%
jan 1, 1988
0.023
+0.019
463.97%
jan 1, 1989
0.0
-0.023
-98.35%
jan 1, 1990
0.004
+0.004
959.31%
jan 1, 1991
0.0
-0.004
-94.26%
jan 1, 2005
0.819
+0.819
350.7K%
jan 1, 2006
1.032
+0.212
25.94%
jan 1, 2007
0.588
-0.444
-43.0%
jan 1, 2008
1.094
+0.506
86.05%
jan 1, 2009
1.41
+0.316
28.9%
jan 1, 2010
1.431
+0.021
1.52%
jan 1, 2011
1.008
-0.423
-29.58%
jan 1, 2012
1.121
+0.113
11.2%
jan 1, 2013
1.56
+0.439
39.15%
jan 1, 2014
2.187
+0.627
40.21%
jan 1, 2015
2.091
-0.096
-4.4%
jan 1, 2016
1.926
-0.164
-7.86%
Ranking of countries by current statistics by years


Comments: