29
/
en
AIzaSyAYiBZKx7MnpbEhh9jyipgxe19OcubqV5w
April 1, 2024
142972
Grenada
GRD
true
2
1
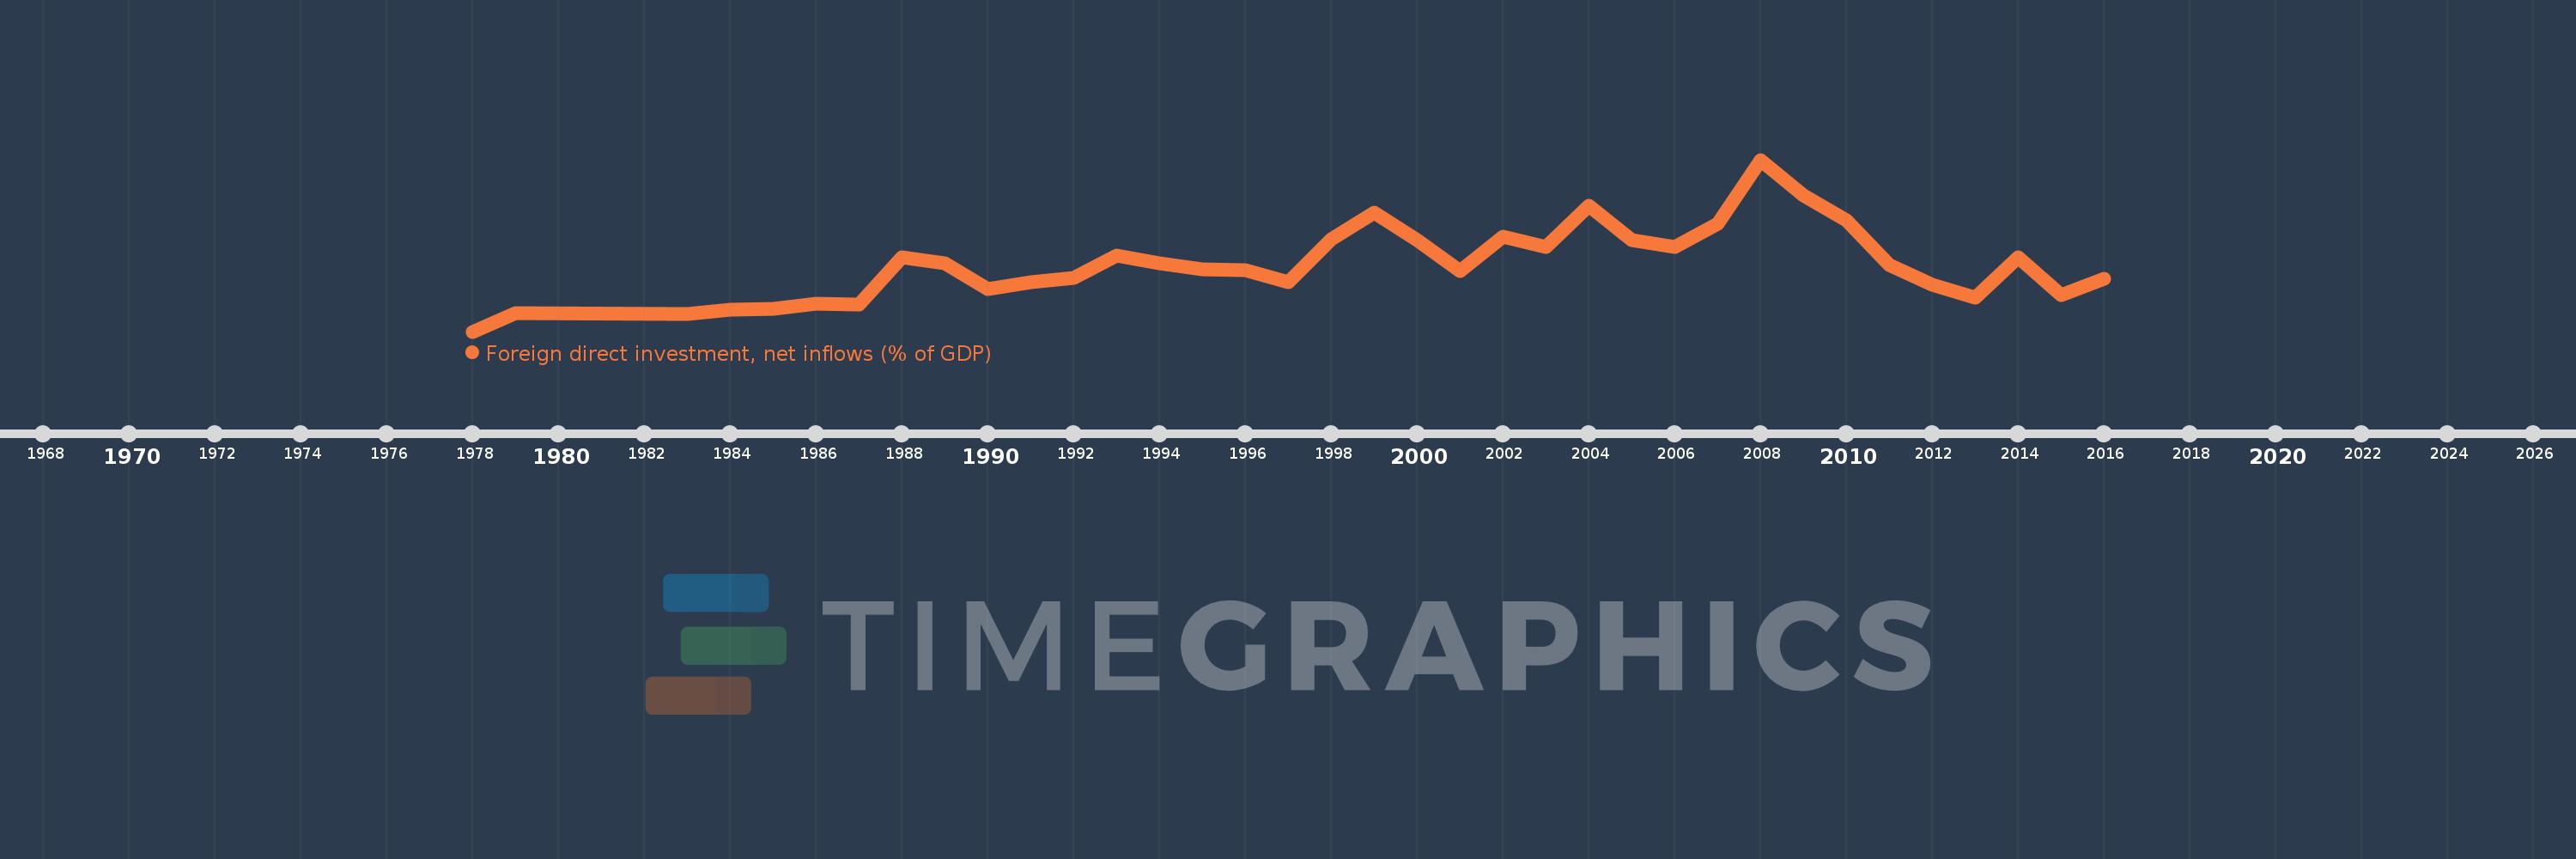
Foreign direct investment, net inflows (% of GDP)
2016,2015,2014,2013,2012,2011,2010,2009,2008,2007,2006,2005,2004,2003,2002,2001,2000,1999,1998,1997,1996,1995,1994,1993,1992,1991,1990,1989,1988,1987,1986,1985,1984,1983,1979,1978
This statistics in other country:
AfghanistanAlbaniaAlgeriaAngolaAntigua and BarbudaArab WorldArgentinaArmeniaArubaAustraliaAustriaAzerbaijanBahamas, TheBahrainBangladeshBarbadosBelarusBelgiumBelizeBeninBermudaBhutanBoliviaBosnia and HerzegovinaBotswanaBrazilBrunei DarussalamBulgariaBurkina FasoBurundiCabo VerdeCambodiaCameroonCanadaCaribbean small statesCayman IslandsCentral African RepublicCentral Europe and the BalticsChadChileChinaColombiaComorosCongo, Dem. Rep.Congo, Rep.Costa RicaCote d'IvoireCroatiaCyprusCzech RepublicDenmarkDjiboutiDominicaDominican RepublicEarly-demographic dividendEast Asia & PacificEast Asia & Pacific (excluding high income)East Asia & Pacific (IDA & IBRD countries)EcuadorEgypt, Arab Rep.El SalvadorEquatorial GuineaEritreaEstoniaEthiopiaEuro areaEurope & Central AsiaEurope & Central Asia (excluding high income)Europe & Central Asia (IDA & IBRD countries)European UnionFijiFinlandFragile and conflict affected situationsFranceFrench PolynesiaGabonGambia, TheGeorgiaGermanyGhanaGreeceGrenadaGuatemalaGuineaGuinea-BissauGuyanaHaitiHeavily indebted poor countries (HIPC)High incomeHondurasHong Kong SAR, ChinaHungaryIBRD onlyIcelandIDA & IBRD totalIDA blendIDA onlyIDA totalIndiaIndonesiaIran, Islamic Rep.IraqIrelandIsraelItalyJamaicaJapanJordanKazakhstanKenyaKiribatiKorea, Rep.KosovoKuwaitKyrgyz RepublicLao PDRLate-demographic dividendLatin America & Caribbean Latin America & Caribbean (excluding high income)Latin America & the Caribbean (IDA & IBRD countries)LatviaLeast developed countries: UN classificationLebanonLesothoLiberiaLibyaLithuaniaLow & middle incomeLow incomeLower middle incomeLuxembourgMacao SAR, ChinaMacedonia, FYRMadagascarMalawiMalaysiaMaldivesMaliMaltaMarshall IslandsMauritaniaMauritiusMexicoMicronesia, Fed. Sts.Middle East & North AfricaMiddle East & North Africa (excluding high income)Middle East & North Africa (IDA & IBRD countries)Middle incomeMoldovaMongoliaMontenegroMoroccoMozambiqueMyanmarNamibiaNauruNepalNetherlandsNew CaledoniaNew ZealandNicaraguaNigerNigeriaNorth AmericaNorwayOECD membersOmanOther small statesPacific island small statesPakistanPalauPanamaPapua New GuineaParaguayPeruPhilippinesPolandPortugalPost-demographic dividendPre-demographic dividendQatarRomaniaRussian FederationRwandaSamoaSao Tome and PrincipeSaudi ArabiaSenegalSerbiaSeychellesSierra LeoneSingaporeSlovak RepublicSloveniaSmall statesSolomon IslandsSomaliaSouth AfricaSouth AsiaSouth Asia (IDA & IBRD)South SudanSpainSri LankaSt. Kitts and NevisSt. LuciaSt. Vincent and the GrenadinesSub-Saharan Africa Sub-Saharan Africa (excluding high income)Sub-Saharan Africa (IDA & IBRD countries)SudanSurinameSwazilandSwedenSwitzerlandSyrian Arab RepublicTajikistanTanzaniaThailandTimor-LesteTogoTongaTrinidad and TobagoTunisiaTurkeyTurkmenistanTuvaluUgandaUkraineUnited Arab EmiratesUnited KingdomUnited StatesUpper middle incomeUruguayUzbekistanVanuatuVenezuela, RBVietnamWest Bank and GazaWorldYemen, Rep.ZambiaZimbabwe Timeline:
This timeline shows a graph from 1978 to 2016 of Grenada. No data until 1977. Number of actual observations by date: 36.
Source name:
World Development Indicators
Source organization:
International Monetary Fund, International Financial Statistics and Balance of Payments databases, World Bank, International Debt Statistics, and World Bank and OECD GDP estimates.
Categories, topics:
Economy & Growth, Financial Sector, Climate Change
Last updated:
apr 23, 2017
Indicators value changes by year
Minimum:
-0.188
jan 1, 1978
At the date of observation
Value
Absolute change
Change from previous value
jan 1, 1978
-0.188
-0.188
0.0%
jan 1, 1979
2.073
+2.26
-1.21K%
jan 1, 1983
1.995
-0.077
-3.74%
jan 1, 1984
2.47
+0.475
23.8%
jan 1, 1985
2.543
+0.073
2.96%
jan 1, 1986
3.207
+0.663
26.08%
jan 1, 1987
3.112
-0.095
-2.95%
jan 1, 1988
8.804
+5.692
182.9%
jan 1, 1989
8.119
-0.685
-7.78%
jan 1, 1990
4.919
-3.199
-39.41%
jan 1, 1991
5.824
+0.904
18.38%
jan 1, 1992
6.323
+0.499
8.57%
jan 1, 1993
9.0
+2.677
42.34%
jan 1, 1994
8.091
-0.909
-10.1%
jan 1, 1995
7.377
-0.714
-8.82%
jan 1, 1996
7.231
-0.146
-1.98%
jan 1, 1997
5.757
-1.474
-20.38%
jan 1, 1998
10.986
+5.229
90.83%
jan 1, 1999
14.285
+3.299
30.03%
jan 1, 2000
10.945
-3.34
-23.38%
jan 1, 2001
7.193
-3.752
-34.28%
jan 1, 2002
11.288
+4.095
56.93%
jan 1, 2003
10.084
-1.204
-10.66%
jan 1, 2004
15.087
+5.003
49.61%
jan 1, 2005
10.852
-4.235
-28.07%
jan 1, 2006
10.089
-0.762
-7.03%
jan 1, 2007
12.854
+2.765
27.4%
jan 1, 2008
20.64
+7.786
60.57%
jan 1, 2009
16.325
-4.315
-20.9%
jan 1, 2010
13.297
-3.028
-18.55%
jan 1, 2011
7.837
-5.46
-41.07%
jan 1, 2012
5.477
-2.359
-30.11%
jan 1, 2013
3.937
-1.54
-28.12%
jan 1, 2014
8.864
+4.928
125.17%
jan 1, 2015
4.196
-4.669
-52.67%
jan 1, 2016
6.166
+1.97
46.95%
Ranking of countries by current statistics by years


Comments: