29
/
en
AIzaSyAYiBZKx7MnpbEhh9jyipgxe19OcubqV5w
April 1, 2024
123476
Ecuador
ECU
true
2
1
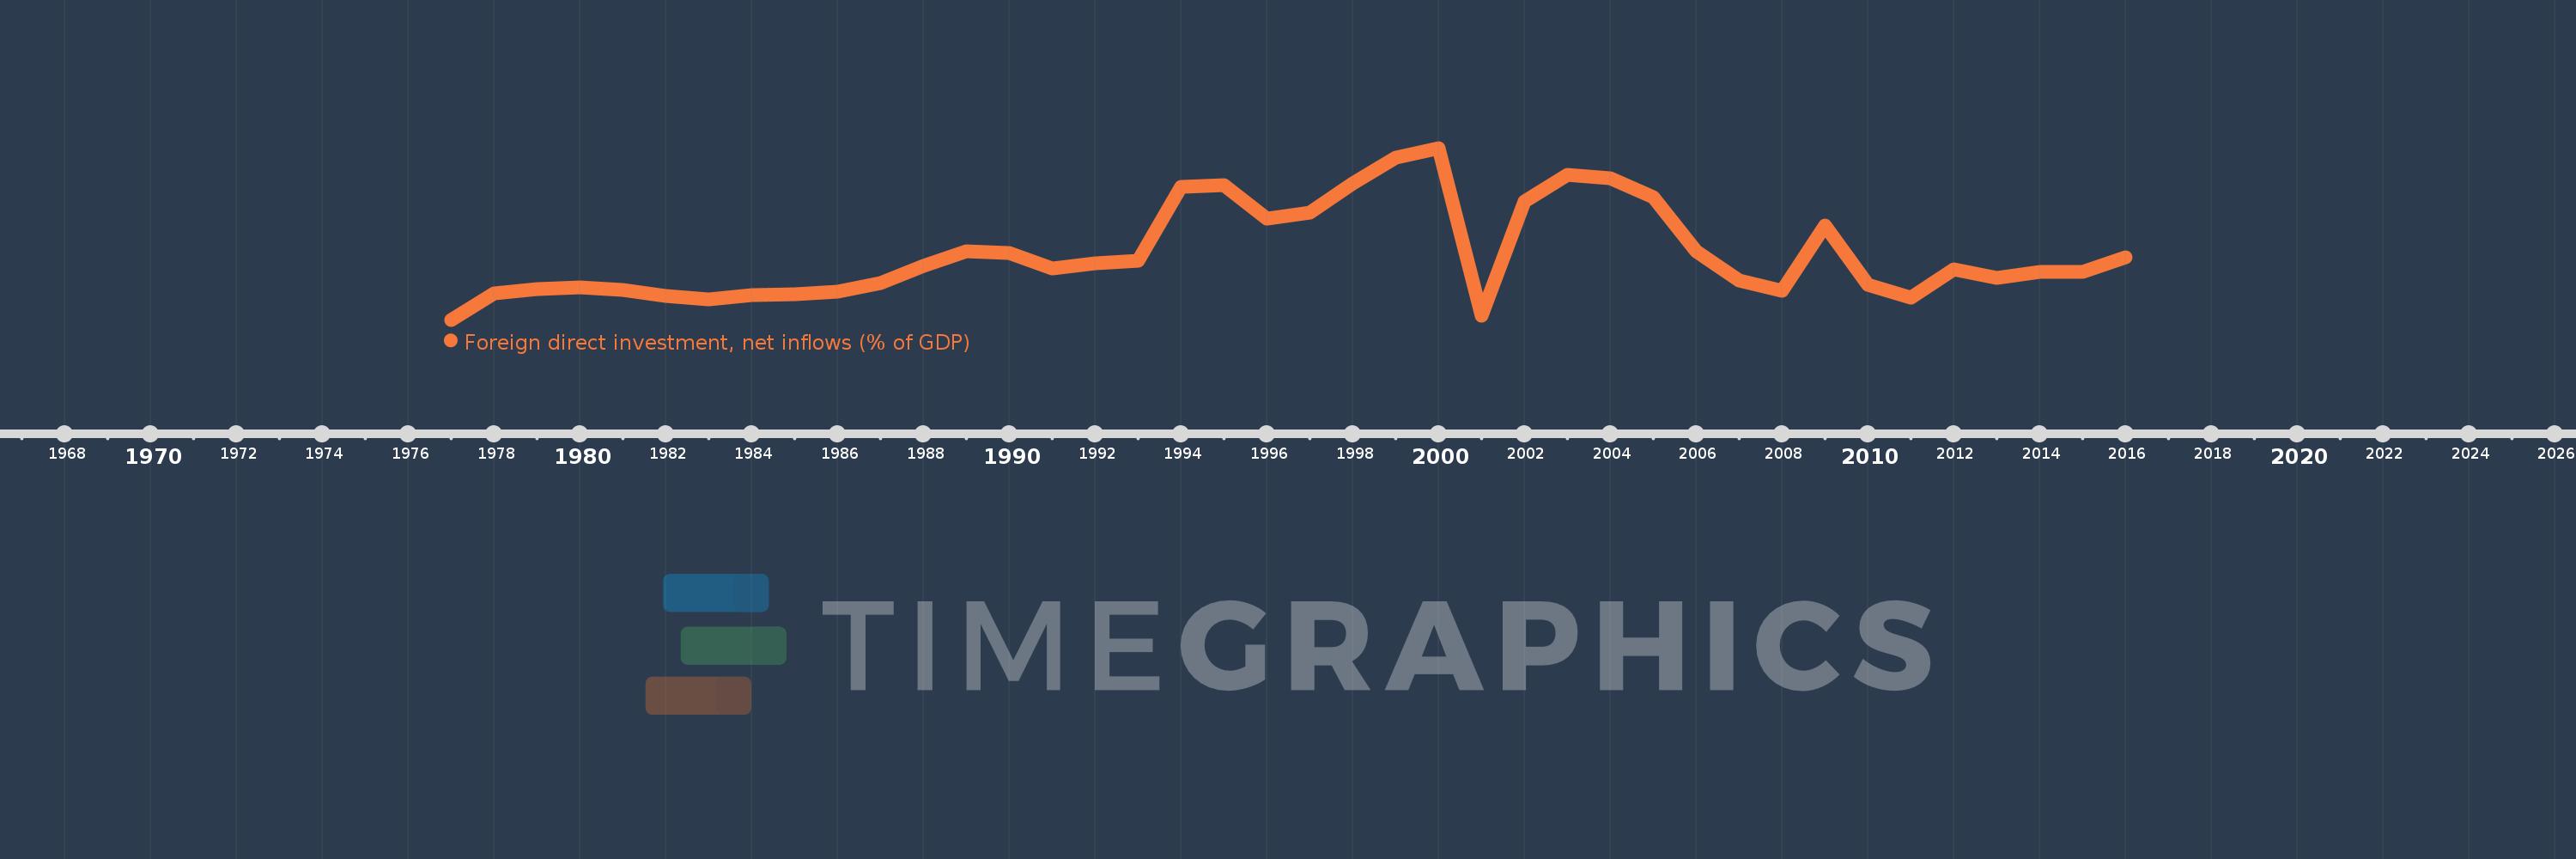
Foreign direct investment, net inflows (% of GDP)
2016,2015,2014,2013,2012,2011,2010,2009,2008,2007,2006,2005,2004,2003,2002,2001,2000,1999,1998,1997,1996,1995,1994,1993,1992,1991,1990,1989,1988,1987,1986,1985,1984,1983,1982,1981,1980,1979,1978,1977
This statistics in other country:
AfghanistanAlbaniaAlgeriaAngolaAntigua and BarbudaArab WorldArgentinaArmeniaArubaAustraliaAustriaAzerbaijanBahamas, TheBahrainBangladeshBarbadosBelarusBelgiumBelizeBeninBermudaBhutanBoliviaBosnia and HerzegovinaBotswanaBrazilBrunei DarussalamBulgariaBurkina FasoBurundiCabo VerdeCambodiaCameroonCanadaCaribbean small statesCayman IslandsCentral African RepublicCentral Europe and the BalticsChadChileChinaColombiaComorosCongo, Dem. Rep.Congo, Rep.Costa RicaCote d'IvoireCroatiaCyprusCzech RepublicDenmarkDjiboutiDominicaDominican RepublicEarly-demographic dividendEast Asia & PacificEast Asia & Pacific (excluding high income)East Asia & Pacific (IDA & IBRD countries)EcuadorEgypt, Arab Rep.El SalvadorEquatorial GuineaEritreaEstoniaEthiopiaEuro areaEurope & Central AsiaEurope & Central Asia (excluding high income)Europe & Central Asia (IDA & IBRD countries)European UnionFijiFinlandFragile and conflict affected situationsFranceFrench PolynesiaGabonGambia, TheGeorgiaGermanyGhanaGreeceGrenadaGuatemalaGuineaGuinea-BissauGuyanaHaitiHeavily indebted poor countries (HIPC)High incomeHondurasHong Kong SAR, ChinaHungaryIBRD onlyIcelandIDA & IBRD totalIDA blendIDA onlyIDA totalIndiaIndonesiaIran, Islamic Rep.IraqIrelandIsraelItalyJamaicaJapanJordanKazakhstanKenyaKiribatiKorea, Rep.KosovoKuwaitKyrgyz RepublicLao PDRLate-demographic dividendLatin America & Caribbean Latin America & Caribbean (excluding high income)Latin America & the Caribbean (IDA & IBRD countries)LatviaLeast developed countries: UN classificationLebanonLesothoLiberiaLibyaLithuaniaLow & middle incomeLow incomeLower middle incomeLuxembourgMacao SAR, ChinaMacedonia, FYRMadagascarMalawiMalaysiaMaldivesMaliMaltaMarshall IslandsMauritaniaMauritiusMexicoMicronesia, Fed. Sts.Middle East & North AfricaMiddle East & North Africa (excluding high income)Middle East & North Africa (IDA & IBRD countries)Middle incomeMoldovaMongoliaMontenegroMoroccoMozambiqueMyanmarNamibiaNauruNepalNetherlandsNew CaledoniaNew ZealandNicaraguaNigerNigeriaNorth AmericaNorwayOECD membersOmanOther small statesPacific island small statesPakistanPalauPanamaPapua New GuineaParaguayPeruPhilippinesPolandPortugalPost-demographic dividendPre-demographic dividendQatarRomaniaRussian FederationRwandaSamoaSao Tome and PrincipeSaudi ArabiaSenegalSerbiaSeychellesSierra LeoneSingaporeSlovak RepublicSloveniaSmall statesSolomon IslandsSomaliaSouth AfricaSouth AsiaSouth Asia (IDA & IBRD)South SudanSpainSri LankaSt. Kitts and NevisSt. LuciaSt. Vincent and the GrenadinesSub-Saharan Africa Sub-Saharan Africa (excluding high income)Sub-Saharan Africa (IDA & IBRD countries)SudanSurinameSwazilandSwedenSwitzerlandSyrian Arab RepublicTajikistanTanzaniaThailandTimor-LesteTogoTongaTrinidad and TobagoTunisiaTurkeyTurkmenistanTuvaluUgandaUkraineUnited Arab EmiratesUnited KingdomUnited StatesUpper middle incomeUruguayUzbekistanVanuatuVenezuela, RBVietnamWest Bank and GazaWorldYemen, Rep.ZambiaZimbabwe Timeline:
This timeline shows a graph from 1977 to 2016 of Ecuador. No data until 1976. Number of actual observations by date: 40.
Source name:
World Development Indicators
Source organization:
International Monetary Fund, International Financial Statistics and Balance of Payments databases, World Bank, International Debt Statistics, and World Bank and OECD GDP estimates.
Categories, topics:
Economy & Growth, Financial Sector, Climate Change
Last updated:
apr 23, 2017
Indicators value changes by year
Minimum:
-0.219
jan 1, 1977
At the date of observation
Value
Absolute change
Change from previous value
jan 1, 1977
-0.219
-0.219
0.0%
jan 1, 1978
0.313
+0.532
-242.95%
jan 1, 1979
0.408
+0.095
30.28%
jan 1, 1980
0.447
+0.04
9.72%
jan 1, 1981
0.391
-0.056
-12.47%
jan 1, 1982
0.275
-0.116
-29.73%
jan 1, 1983
0.201
-0.074
-27.04%
jan 1, 1984
0.292
+0.091
45.24%
jan 1, 1985
0.296
+0.004
1.42%
jan 1, 1986
0.362
+0.066
22.29%
jan 1, 1987
0.529
+0.167
46.3%
jan 1, 1988
0.882
+0.353
66.76%
jan 1, 1989
1.188
+0.306
34.64%
jan 1, 1990
1.152
-0.036
-3.01%
jan 1, 1991
0.827
-0.325
-28.22%
jan 1, 1992
0.942
+0.115
13.91%
jan 1, 1993
0.984
+0.042
4.45%
jan 1, 1994
2.501
+1.518
154.27%
jan 1, 1995
2.538
+0.037
1.46%
jan 1, 1996
1.852
-0.686
-27.03%
jan 1, 1997
1.981
+0.129
6.96%
jan 1, 1998
2.571
+0.59
29.78%
jan 1, 1999
3.109
+0.538
20.94%
jan 1, 2000
3.301
+0.192
6.16%
jan 1, 2001
-0.128
-3.428
-103.87%
jan 1, 2002
2.201
+2.329
-1.82K%
jan 1, 2003
2.744
+0.542
24.65%
jan 1, 2004
2.687
-0.056
-2.06%
jan 1, 2005
2.287
-0.4
-14.88%
jan 1, 2006
1.189
-1.098
-48.03%
jan 1, 2007
0.58
-0.609
-51.21%
jan 1, 2008
0.38
-0.2
-34.46%
jan 1, 2009
1.711
+1.331
350.22%
jan 1, 2010
0.493
-1.219
-71.21%
jan 1, 2011
0.238
-0.255
-51.75%
jan 1, 2012
0.812
+0.574
241.62%
jan 1, 2013
0.645
-0.167
-20.58%
jan 1, 2014
0.764
+0.119
18.47%
jan 1, 2015
0.756
-0.008
-1.1%
jan 1, 2016
1.058
+0.303
40.04%
Ranking of countries by current statistics by years


Comments: