29
/
en
AIzaSyAYiBZKx7MnpbEhh9jyipgxe19OcubqV5w
April 1, 2024
113566
Cote d'Ivoire
CIV
true
2
1
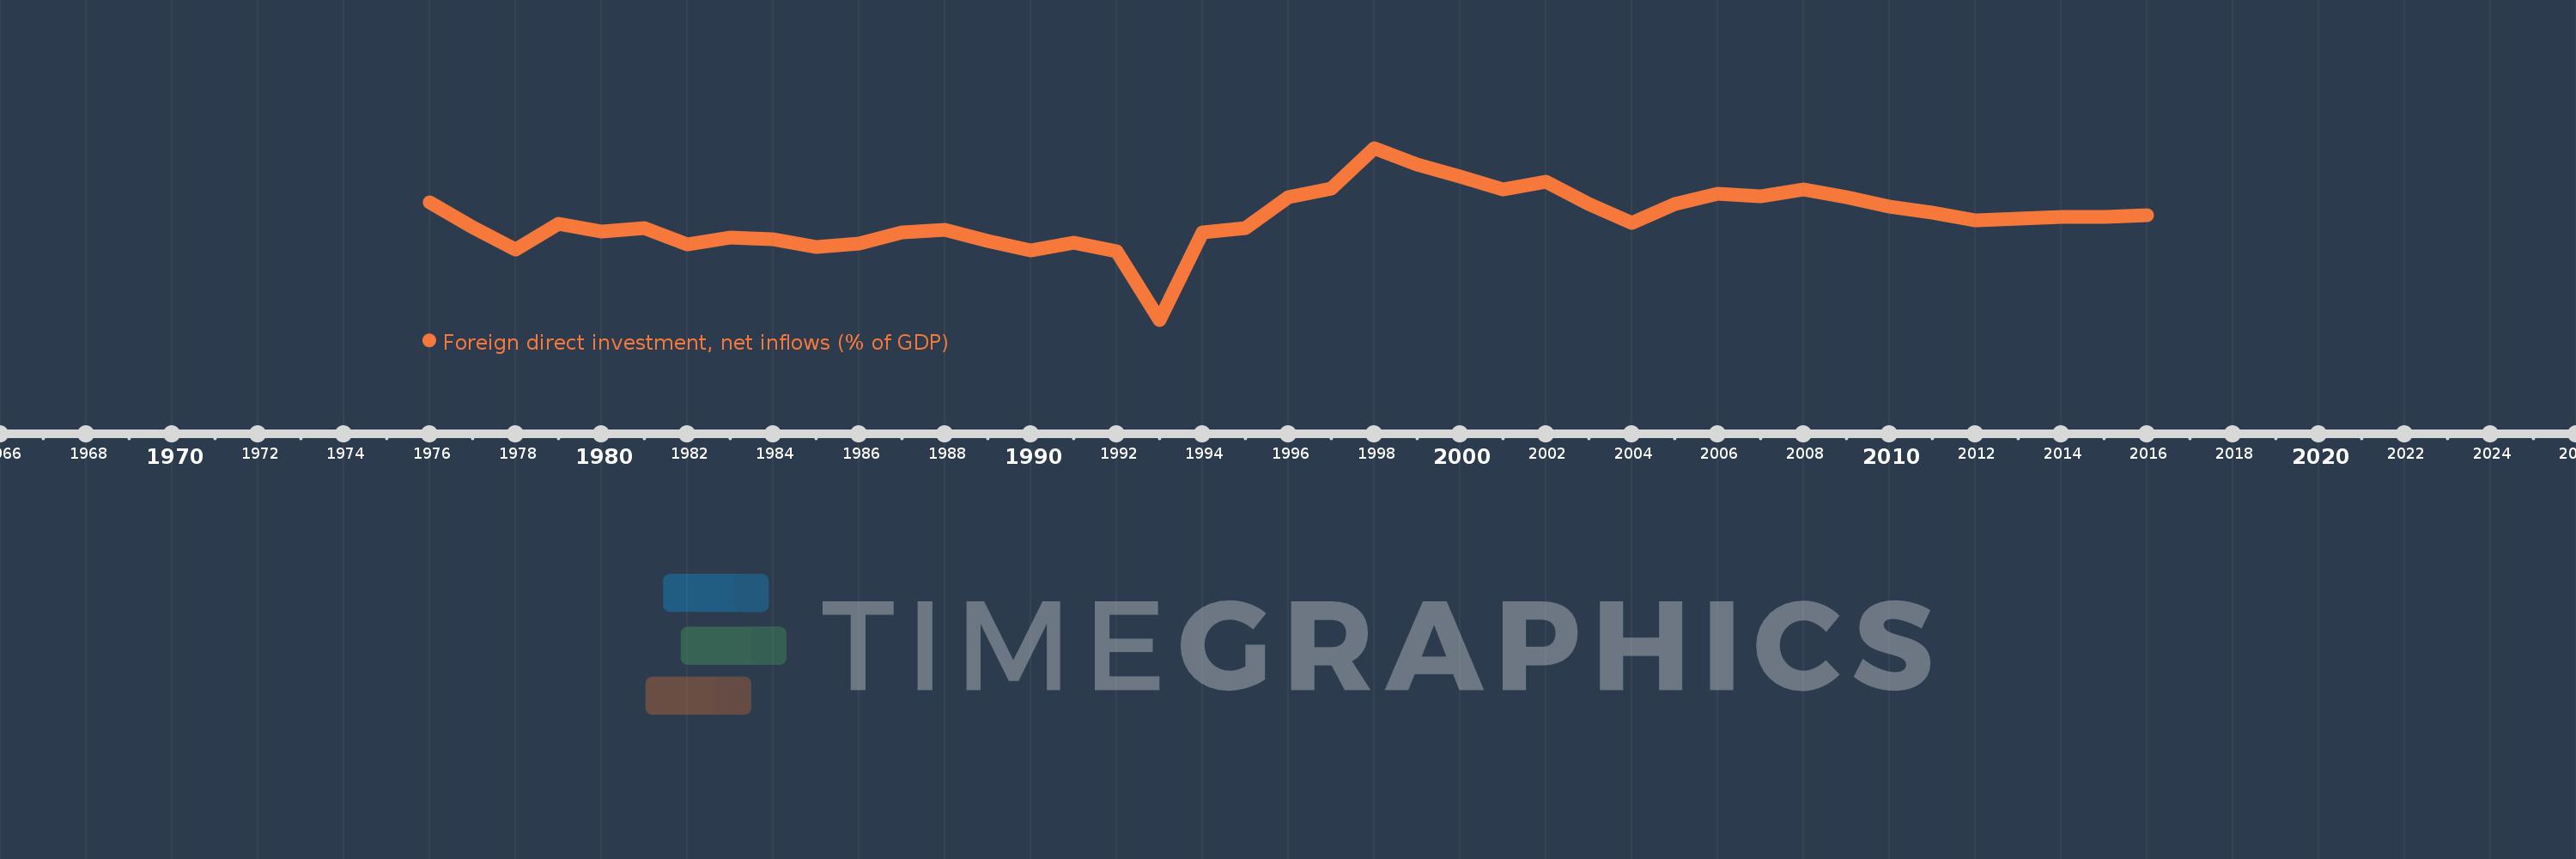
Foreign direct investment, net inflows (% of GDP)
2016,2015,2014,2013,2012,2011,2010,2009,2008,2007,2006,2005,2004,2003,2002,2001,2000,1999,1998,1997,1996,1995,1994,1993,1992,1991,1990,1989,1988,1987,1986,1985,1984,1983,1982,1981,1980,1979,1978,1977,1976
This statistics in other country:
AfghanistanAlbaniaAlgeriaAngolaAntigua and BarbudaArab WorldArgentinaArmeniaArubaAustraliaAustriaAzerbaijanBahamas, TheBahrainBangladeshBarbadosBelarusBelgiumBelizeBeninBermudaBhutanBoliviaBosnia and HerzegovinaBotswanaBrazilBrunei DarussalamBulgariaBurkina FasoBurundiCabo VerdeCambodiaCameroonCanadaCaribbean small statesCayman IslandsCentral African RepublicCentral Europe and the BalticsChadChileChinaColombiaComorosCongo, Dem. Rep.Congo, Rep.Costa RicaCote d'IvoireCroatiaCyprusCzech RepublicDenmarkDjiboutiDominicaDominican RepublicEarly-demographic dividendEast Asia & PacificEast Asia & Pacific (excluding high income)East Asia & Pacific (IDA & IBRD countries)EcuadorEgypt, Arab Rep.El SalvadorEquatorial GuineaEritreaEstoniaEthiopiaEuro areaEurope & Central AsiaEurope & Central Asia (excluding high income)Europe & Central Asia (IDA & IBRD countries)European UnionFijiFinlandFragile and conflict affected situationsFranceFrench PolynesiaGabonGambia, TheGeorgiaGermanyGhanaGreeceGrenadaGuatemalaGuineaGuinea-BissauGuyanaHaitiHeavily indebted poor countries (HIPC)High incomeHondurasHong Kong SAR, ChinaHungaryIBRD onlyIcelandIDA & IBRD totalIDA blendIDA onlyIDA totalIndiaIndonesiaIran, Islamic Rep.IraqIrelandIsraelItalyJamaicaJapanJordanKazakhstanKenyaKiribatiKorea, Rep.KosovoKuwaitKyrgyz RepublicLao PDRLate-demographic dividendLatin America & Caribbean Latin America & Caribbean (excluding high income)Latin America & the Caribbean (IDA & IBRD countries)LatviaLeast developed countries: UN classificationLebanonLesothoLiberiaLibyaLithuaniaLow & middle incomeLow incomeLower middle incomeLuxembourgMacao SAR, ChinaMacedonia, FYRMadagascarMalawiMalaysiaMaldivesMaliMaltaMarshall IslandsMauritaniaMauritiusMexicoMicronesia, Fed. Sts.Middle East & North AfricaMiddle East & North Africa (excluding high income)Middle East & North Africa (IDA & IBRD countries)Middle incomeMoldovaMongoliaMontenegroMoroccoMozambiqueMyanmarNamibiaNauruNepalNetherlandsNew CaledoniaNew ZealandNicaraguaNigerNigeriaNorth AmericaNorwayOECD membersOmanOther small statesPacific island small statesPakistanPalauPanamaPapua New GuineaParaguayPeruPhilippinesPolandPortugalPost-demographic dividendPre-demographic dividendQatarRomaniaRussian FederationRwandaSamoaSao Tome and PrincipeSaudi ArabiaSenegalSerbiaSeychellesSierra LeoneSingaporeSlovak RepublicSloveniaSmall statesSolomon IslandsSomaliaSouth AfricaSouth AsiaSouth Asia (IDA & IBRD)South SudanSpainSri LankaSt. Kitts and NevisSt. LuciaSt. Vincent and the GrenadinesSub-Saharan Africa Sub-Saharan Africa (excluding high income)Sub-Saharan Africa (IDA & IBRD countries)SudanSurinameSwazilandSwedenSwitzerlandSyrian Arab RepublicTajikistanTanzaniaThailandTimor-LesteTogoTongaTrinidad and TobagoTunisiaTurkeyTurkmenistanTuvaluUgandaUkraineUnited Arab EmiratesUnited KingdomUnited StatesUpper middle incomeUruguayUzbekistanVanuatuVenezuela, RBVietnamWest Bank and GazaWorldYemen, Rep.ZambiaZimbabwe Timeline:
This timeline shows a graph from 1976 to 2016 of Cote d'Ivoire. No data until 1975. Number of actual observations by date: 41.
Source name:
World Development Indicators
Source organization:
International Monetary Fund, International Financial Statistics and Balance of Payments databases, World Bank, International Debt Statistics, and World Bank and OECD GDP estimates.
Categories, topics:
Economy & Growth, Financial Sector, Climate Change
Last updated:
apr 23, 2017
Indicators value changes by year
At the date of observation
Value
Absolute change
Change from previous value
jan 1, 1976
1.774
+1.774
0.0%
jan 1, 1977
0.961
-0.813
-45.84%
jan 1, 1978
0.234
-0.727
-75.65%
jan 1, 1979
1.055
+0.821
350.87%
jan 1, 1980
0.818
-0.237
-22.47%
jan 1, 1981
0.93
+0.113
13.79%
jan 1, 1982
0.388
-0.542
-58.25%
jan 1, 1983
0.627
+0.239
61.52%
jan 1, 1984
0.549
-0.079
-12.53%
jan 1, 1985
0.318
-0.231
-42.09%
jan 1, 1986
0.418
+0.1
31.5%
jan 1, 1987
0.772
+0.355
84.85%
jan 1, 1988
0.867
+0.095
12.3%
jan 1, 1989
0.504
-0.363
-41.88%
jan 1, 1990
0.19
-0.315
-62.4%
jan 1, 1991
0.446
+0.256
135.13%
jan 1, 1992
0.155
-0.29
-65.13%
jan 1, 1993
-2.07
-2.225
-1.43K%
jan 1, 1994
0.796
+2.865
-138.45%
jan 1, 1995
0.938
+0.142
17.88%
jan 1, 1996
1.923
+0.984
104.94%
jan 1, 1997
2.217
+0.295
15.34%
jan 1, 1998
3.543
+1.325
59.77%
jan 1, 1999
3.013
-0.53
-14.95%
jan 1, 2000
2.615
-0.398
-13.21%
jan 1, 2001
2.19
-0.425
-16.26%
jan 1, 2002
2.436
+0.246
11.25%
jan 1, 2003
1.722
-0.714
-29.31%
jan 1, 2004
1.08
-0.642
-37.27%
jan 1, 2005
1.709
+0.629
58.24%
jan 1, 2006
2.042
+0.333
19.47%
jan 1, 2007
1.97
-0.072
-3.55%
jan 1, 2008
2.179
+0.209
10.6%
jan 1, 2009
1.926
-0.253
-11.61%
jan 1, 2010
1.631
-0.294
-15.29%
jan 1, 2011
1.439
-0.192
-11.78%
jan 1, 2012
1.188
-0.251
-17.44%
jan 1, 2013
1.221
+0.033
2.8%
jan 1, 2014
1.303
+0.082
6.71%
jan 1, 2015
1.282
-0.021
-1.61%
jan 1, 2016
1.354
+0.072
5.63%
Ranking of countries by current statistics by years


Comments: