29
/
en
AIzaSyAYiBZKx7MnpbEhh9jyipgxe19OcubqV5w
April 1, 2024
52594
OECD members
OED
false
2
1
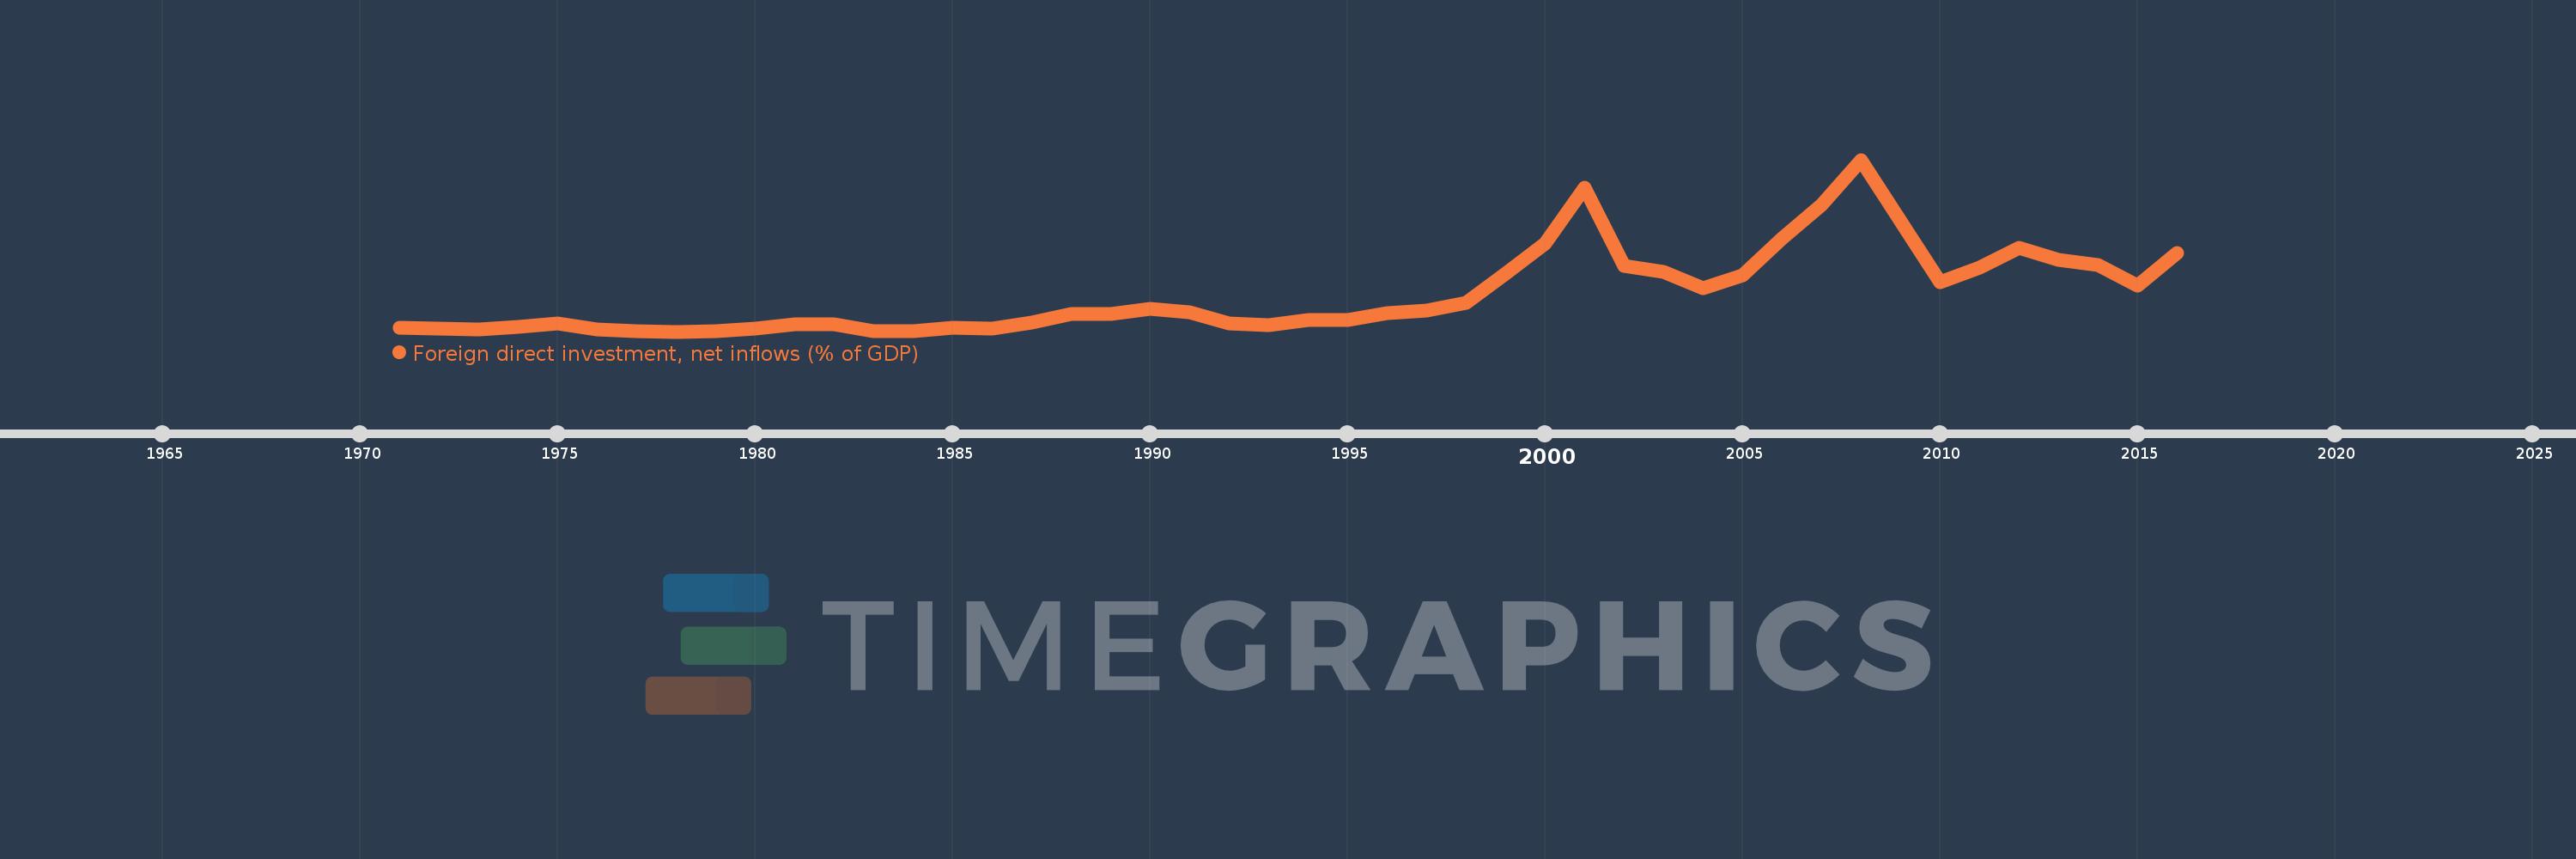
Foreign direct investment, net inflows (% of GDP)
2016,2015,2014,2013,2012,2011,2010,2009,2008,2007,2006,2005,2004,2003,2002,2001,2000,1999,1998,1997,1996,1995,1994,1993,1992,1991,1990,1989,1988,1987,1986,1985,1984,1983,1982,1981,1980,1979,1978,1977,1976,1975,1974,1973,1972,1971
This statistics in other country:
AfghanistanAlbaniaAlgeriaAngolaAntigua and BarbudaArab WorldArgentinaArmeniaArubaAustraliaAustriaAzerbaijanBahamas, TheBahrainBangladeshBarbadosBelarusBelgiumBelizeBeninBermudaBhutanBoliviaBosnia and HerzegovinaBotswanaBrazilBrunei DarussalamBulgariaBurkina FasoBurundiCabo VerdeCambodiaCameroonCanadaCaribbean small statesCayman IslandsCentral African RepublicCentral Europe and the BalticsChadChileChinaColombiaComorosCongo, Dem. Rep.Congo, Rep.Costa RicaCote d'IvoireCroatiaCyprusCzech RepublicDenmarkDjiboutiDominicaDominican RepublicEarly-demographic dividendEast Asia & PacificEast Asia & Pacific (excluding high income)East Asia & Pacific (IDA & IBRD countries)EcuadorEgypt, Arab Rep.El SalvadorEquatorial GuineaEritreaEstoniaEthiopiaEuro areaEurope & Central AsiaEurope & Central Asia (excluding high income)Europe & Central Asia (IDA & IBRD countries)European UnionFijiFinlandFragile and conflict affected situationsFranceFrench PolynesiaGabonGambia, TheGeorgiaGermanyGhanaGreeceGrenadaGuatemalaGuineaGuinea-BissauGuyanaHaitiHeavily indebted poor countries (HIPC)High incomeHondurasHong Kong SAR, ChinaHungaryIBRD onlyIcelandIDA & IBRD totalIDA blendIDA onlyIDA totalIndiaIndonesiaIran, Islamic Rep.IraqIrelandIsraelItalyJamaicaJapanJordanKazakhstanKenyaKiribatiKorea, Rep.KosovoKuwaitKyrgyz RepublicLao PDRLate-demographic dividendLatin America & Caribbean Latin America & Caribbean (excluding high income)Latin America & the Caribbean (IDA & IBRD countries)LatviaLeast developed countries: UN classificationLebanonLesothoLiberiaLibyaLithuaniaLow & middle incomeLow incomeLower middle incomeLuxembourgMacao SAR, ChinaMacedonia, FYRMadagascarMalawiMalaysiaMaldivesMaliMaltaMarshall IslandsMauritaniaMauritiusMexicoMicronesia, Fed. Sts.Middle East & North AfricaMiddle East & North Africa (excluding high income)Middle East & North Africa (IDA & IBRD countries)Middle incomeMoldovaMongoliaMontenegroMoroccoMozambiqueMyanmarNamibiaNauruNepalNetherlandsNew CaledoniaNew ZealandNicaraguaNigerNigeriaNorth AmericaNorwayOECD membersOmanOther small statesPacific island small statesPakistanPalauPanamaPapua New GuineaParaguayPeruPhilippinesPolandPortugalPost-demographic dividendPre-demographic dividendQatarRomaniaRussian FederationRwandaSamoaSao Tome and PrincipeSaudi ArabiaSenegalSerbiaSeychellesSierra LeoneSingaporeSlovak RepublicSloveniaSmall statesSolomon IslandsSomaliaSouth AfricaSouth AsiaSouth Asia (IDA & IBRD)South SudanSpainSri LankaSt. Kitts and NevisSt. LuciaSt. Vincent and the GrenadinesSub-Saharan Africa Sub-Saharan Africa (excluding high income)Sub-Saharan Africa (IDA & IBRD countries)SudanSurinameSwazilandSwedenSwitzerlandSyrian Arab RepublicTajikistanTanzaniaThailandTimor-LesteTogoTongaTrinidad and TobagoTunisiaTurkeyTurkmenistanTuvaluUgandaUkraineUnited Arab EmiratesUnited KingdomUnited StatesUpper middle incomeUruguayUzbekistanVanuatuVenezuela, RBVietnamWest Bank and GazaWorldYemen, Rep.ZambiaZimbabwe Timeline:
This timeline shows a graph from 1971 to 2016 of OECD members. No data until 1970. Number of actual observations by date: 46.
Source name:
World Development Indicators
Source organization:
International Monetary Fund, International Financial Statistics and Balance of Payments databases, World Bank, International Debt Statistics, and World Bank and OECD GDP estimates.
Categories, topics:
Economy & Growth, Financial Sector, Climate Change
Last updated:
apr 23, 2017
Indicators value changes by year
At the date of observation
Value
Absolute change
Change from previous value
jan 1, 1971
0.459
+0.459
0.0%
jan 1, 1972
0.451
-0.009
-1.87%
jan 1, 1973
0.426
-0.025
-5.44%
jan 1, 1974
0.495
+0.068
16.06%
jan 1, 1975
0.598
+0.103
20.83%
jan 1, 1976
0.415
-0.183
-30.55%
jan 1, 1977
0.356
-0.059
-14.11%
jan 1, 1978
0.355
-0.002
-0.45%
jan 1, 1979
0.379
+0.024
6.72%
jan 1, 1980
0.45
+0.071
18.7%
jan 1, 1981
0.563
+0.113
25.17%
jan 1, 1982
0.559
-0.004
-0.74%
jan 1, 1983
0.372
-0.187
-33.47%
jan 1, 1984
0.379
+0.007
1.87%
jan 1, 1985
0.456
+0.077
20.39%
jan 1, 1986
0.447
-0.009
-1.91%
jan 1, 1987
0.625
+0.178
39.73%
jan 1, 1988
0.855
+0.23
36.86%
jan 1, 1989
0.861
+0.006
0.74%
jan 1, 1990
1.027
+0.165
19.21%
jan 1, 1991
0.919
-0.107
-10.44%
jan 1, 1992
0.59
-0.329
-35.81%
jan 1, 1993
0.532
-0.058
-9.9%
jan 1, 1994
0.688
+0.156
29.3%
jan 1, 1995
0.7
+0.013
1.85%
jan 1, 1996
0.901
+0.201
28.68%
jan 1, 1997
0.967
+0.066
7.27%
jan 1, 1998
1.197
+0.23
23.81%
jan 1, 1999
2.031
+0.835
69.73%
jan 1, 2000
2.912
+0.881
43.37%
jan 1, 2001
4.535
+1.623
55.71%
jan 1, 2002
2.263
-2.272
-50.11%
jan 1, 2003
2.087
-0.175
-7.74%
jan 1, 2004
1.625
-0.462
-22.15%
jan 1, 2005
1.998
+0.373
22.95%
jan 1, 2006
3.055
+1.057
52.91%
jan 1, 2007
4.029
+0.974
31.87%
jan 1, 2008
5.345
+1.316
32.67%
jan 1, 2009
3.565
-1.78
-33.3%
jan 1, 2010
1.781
-1.785
-50.05%
jan 1, 2011
2.222
+0.441
24.79%
jan 1, 2012
2.786
+0.564
25.36%
jan 1, 2013
2.447
-0.339
-12.17%
jan 1, 2014
2.279
-0.167
-6.84%
jan 1, 2015
1.689
-0.591
-25.91%
jan 1, 2016
2.635
+0.946
56.03%
Ranking of countries by current statistics by years


Comments: