29
/
en
AIzaSyAYiBZKx7MnpbEhh9jyipgxe19OcubqV5w
April 1, 2024
185160
Madagascar
MDG
true
2
1
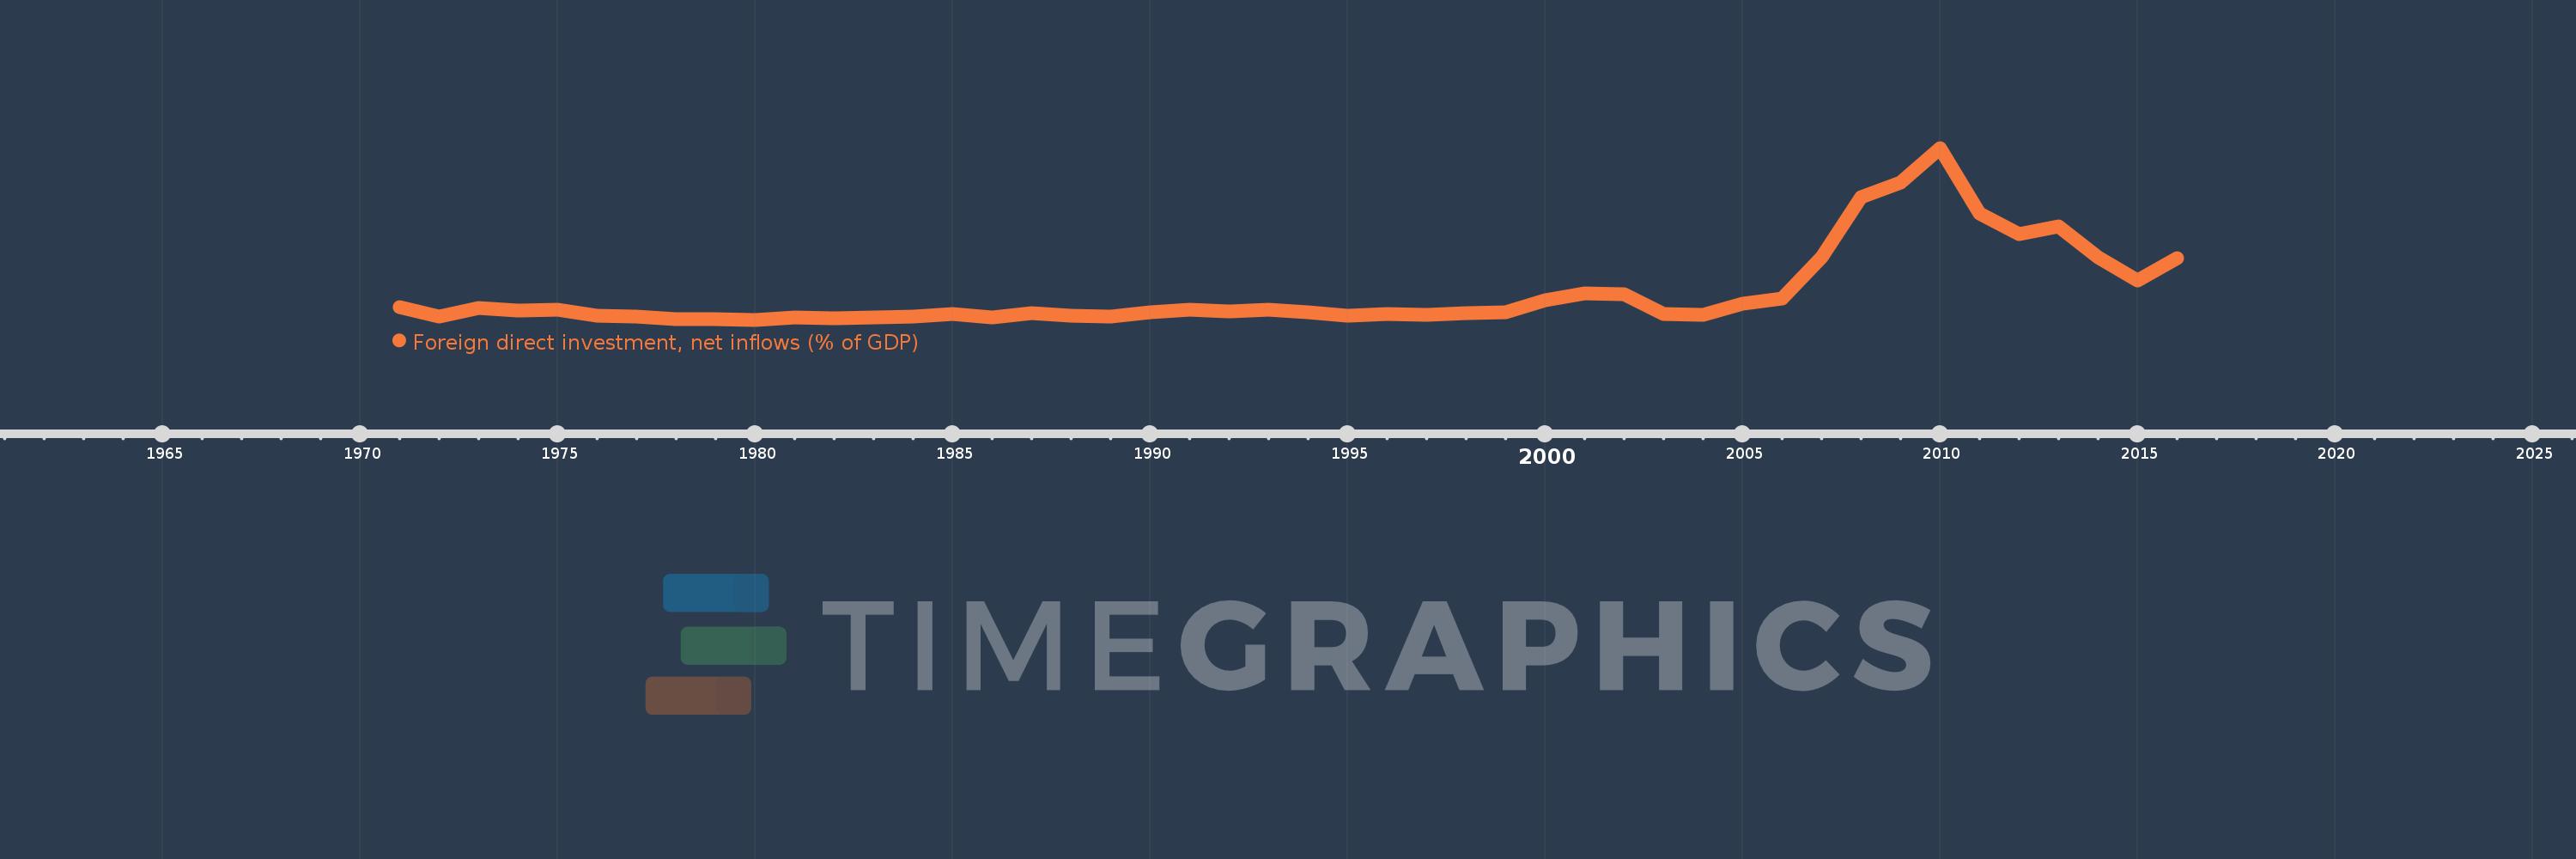
Foreign direct investment, net inflows (% of GDP)
2016,2015,2014,2013,2012,2011,2010,2009,2008,2007,2006,2005,2004,2003,2002,2001,2000,1999,1998,1997,1996,1995,1994,1993,1992,1991,1990,1989,1988,1987,1986,1985,1984,1983,1982,1981,1980,1979,1978,1977,1976,1975,1974,1973,1972,1971
This statistics in other country:
AfghanistanAlbaniaAlgeriaAngolaAntigua and BarbudaArab WorldArgentinaArmeniaArubaAustraliaAustriaAzerbaijanBahamas, TheBahrainBangladeshBarbadosBelarusBelgiumBelizeBeninBermudaBhutanBoliviaBosnia and HerzegovinaBotswanaBrazilBrunei DarussalamBulgariaBurkina FasoBurundiCabo VerdeCambodiaCameroonCanadaCaribbean small statesCayman IslandsCentral African RepublicCentral Europe and the BalticsChadChileChinaColombiaComorosCongo, Dem. Rep.Congo, Rep.Costa RicaCote d'IvoireCroatiaCyprusCzech RepublicDenmarkDjiboutiDominicaDominican RepublicEarly-demographic dividendEast Asia & PacificEast Asia & Pacific (excluding high income)East Asia & Pacific (IDA & IBRD countries)EcuadorEgypt, Arab Rep.El SalvadorEquatorial GuineaEritreaEstoniaEthiopiaEuro areaEurope & Central AsiaEurope & Central Asia (excluding high income)Europe & Central Asia (IDA & IBRD countries)European UnionFijiFinlandFragile and conflict affected situationsFranceFrench PolynesiaGabonGambia, TheGeorgiaGermanyGhanaGreeceGrenadaGuatemalaGuineaGuinea-BissauGuyanaHaitiHeavily indebted poor countries (HIPC)High incomeHondurasHong Kong SAR, ChinaHungaryIBRD onlyIcelandIDA & IBRD totalIDA blendIDA onlyIDA totalIndiaIndonesiaIran, Islamic Rep.IraqIrelandIsraelItalyJamaicaJapanJordanKazakhstanKenyaKiribatiKorea, Rep.KosovoKuwaitKyrgyz RepublicLao PDRLate-demographic dividendLatin America & Caribbean Latin America & Caribbean (excluding high income)Latin America & the Caribbean (IDA & IBRD countries)LatviaLeast developed countries: UN classificationLebanonLesothoLiberiaLibyaLithuaniaLow & middle incomeLow incomeLower middle incomeLuxembourgMacao SAR, ChinaMacedonia, FYRMadagascarMalawiMalaysiaMaldivesMaliMaltaMarshall IslandsMauritaniaMauritiusMexicoMicronesia, Fed. Sts.Middle East & North AfricaMiddle East & North Africa (excluding high income)Middle East & North Africa (IDA & IBRD countries)Middle incomeMoldovaMongoliaMontenegroMoroccoMozambiqueMyanmarNamibiaNauruNepalNetherlandsNew CaledoniaNew ZealandNicaraguaNigerNigeriaNorth AmericaNorwayOECD membersOmanOther small statesPacific island small statesPakistanPalauPanamaPapua New GuineaParaguayPeruPhilippinesPolandPortugalPost-demographic dividendPre-demographic dividendQatarRomaniaRussian FederationRwandaSamoaSao Tome and PrincipeSaudi ArabiaSenegalSerbiaSeychellesSierra LeoneSingaporeSlovak RepublicSloveniaSmall statesSolomon IslandsSomaliaSouth AfricaSouth AsiaSouth Asia (IDA & IBRD)South SudanSpainSri LankaSt. Kitts and NevisSt. LuciaSt. Vincent and the GrenadinesSub-Saharan Africa Sub-Saharan Africa (excluding high income)Sub-Saharan Africa (IDA & IBRD countries)SudanSurinameSwazilandSwedenSwitzerlandSyrian Arab RepublicTajikistanTanzaniaThailandTimor-LesteTogoTongaTrinidad and TobagoTunisiaTurkeyTurkmenistanTuvaluUgandaUkraineUnited Arab EmiratesUnited KingdomUnited StatesUpper middle incomeUruguayUzbekistanVanuatuVenezuela, RBVietnamWest Bank and GazaWorldYemen, Rep.ZambiaZimbabwe Timeline:
This timeline shows a graph from 1971 to 2016 of Madagascar. No data until 1970. Number of actual observations by date: 46.
Source name:
World Development Indicators
Source organization:
International Monetary Fund, International Financial Statistics and Balance of Payments databases, World Bank, International Debt Statistics, and World Bank and OECD GDP estimates.
Categories, topics:
Economy & Growth, Financial Sector, Climate Change
Last updated:
apr 23, 2017
Indicators value changes by year
Maximum:
15.126
jan 1, 2010
At the date of observation
Value
Absolute change
Change from previous value
jan 1, 1971
0.899
+0.899
0.0%
jan 1, 1972
0.09
-0.809
-89.99%
jan 1, 1973
0.894
+0.804
893.44%
jan 1, 1974
0.665
-0.229
-25.61%
jan 1, 1975
0.715
+0.05
7.45%
jan 1, 1976
0.2
-0.515
-71.99%
jan 1, 1977
0.063
-0.137
-68.4%
jan 1, 1978
-0.117
-0.181
-285.37%
jan 1, 1979
-0.138
-0.02
17.42%
jan 1, 1980
-0.19
-0.052
37.92%
jan 1, 1981
-0.02
+0.17
-89.71%
jan 1, 1982
-0.022
-0.003
13.87%
jan 1, 1983
-0.003
+0.02
-88.53%
jan 1, 1984
0.106
+0.108
-4.24K%
jan 1, 1985
0.292
+0.186
175.95%
jan 1, 1986
-0.006
-0.298
-102.16%
jan 1, 1987
0.431
+0.437
-6.94K%
jan 1, 1988
0.135
-0.296
-68.61%
jan 1, 1989
0.119
-0.016
-11.91%
jan 1, 1990
0.513
+0.394
330.63%
jan 1, 1991
0.727
+0.213
41.61%
jan 1, 1992
0.516
-0.211
-29.02%
jan 1, 1993
0.699
+0.183
35.5%
jan 1, 1994
0.456
-0.243
-34.8%
jan 1, 1995
0.192
-0.263
-57.77%
jan 1, 1996
0.307
+0.115
59.71%
jan 1, 1997
0.254
-0.053
-17.22%
jan 1, 1998
0.395
+0.141
55.29%
jan 1, 1999
0.445
+0.05
12.65%
jan 1, 2000
1.571
+1.126
252.97%
jan 1, 2001
2.139
+0.569
36.21%
jan 1, 2002
2.054
-0.085
-3.96%
jan 1, 2003
0.333
-1.721
-83.77%
jan 1, 2004
0.235
-0.098
-29.47%
jan 1, 2005
1.212
+0.977
415.53%
jan 1, 2006
1.695
+0.483
39.82%
jan 1, 2007
5.342
+3.647
215.14%
jan 1, 2008
10.75
+5.408
101.23%
jan 1, 2009
12.052
+1.302
12.11%
jan 1, 2010
15.126
+3.074
25.5%
jan 1, 2011
9.275
-5.851
-38.68%
jan 1, 2012
7.465
-1.81
-19.52%
jan 1, 2013
8.171
+0.706
9.46%
jan 1, 2014
5.344
-2.827
-34.6%
jan 1, 2015
3.285
-2.059
-38.52%
jan 1, 2016
5.313
+2.028
61.74%
Ranking of countries by current statistics by years


Comments: