29
/
en
AIzaSyAYiBZKx7MnpbEhh9jyipgxe19OcubqV5w
April 1, 2024
99879
Cameroon
CMR
true
2
1
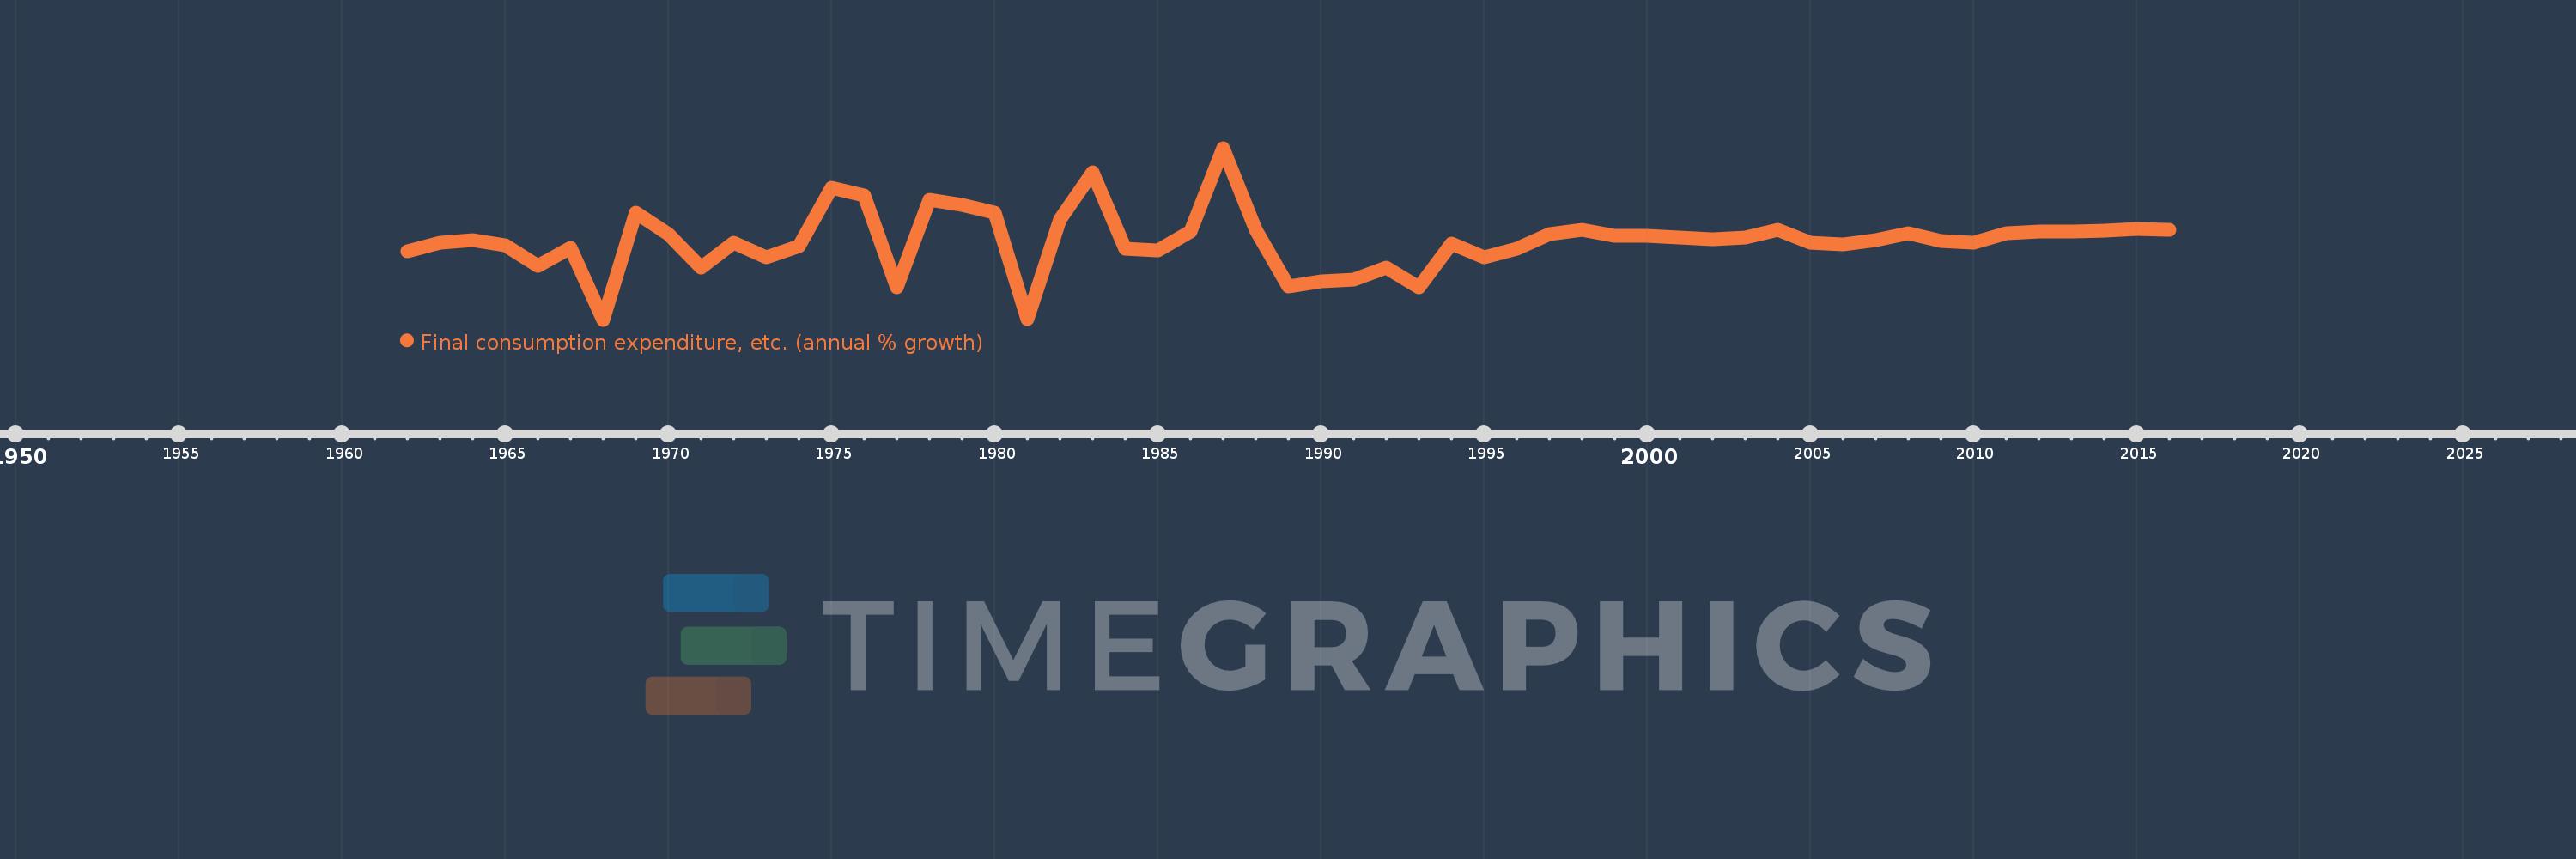
Final consumption expenditure, etc. (annual % growth)
2016,2015,2014,2013,2012,2011,2010,2009,2008,2007,2006,2005,2004,2003,2002,2001,2000,1999,1998,1997,1996,1995,1994,1993,1992,1991,1990,1989,1988,1987,1986,1985,1984,1983,1982,1981,1980,1979,1978,1977,1976,1975,1974,1973,1972,1971,1970,1969,1968,1967,1966,1965,1964,1963,1962
This statistics in other country:
AlbaniaAlgeriaAntigua and BarbudaArab WorldArgentinaArmeniaAustraliaAustriaAzerbaijanBahamas, TheBahrainBangladeshBarbadosBelarusBelgiumBelizeBeninBhutanBoliviaBosnia and HerzegovinaBotswanaBrazilBrunei DarussalamBulgariaBurkina FasoBurundiCabo VerdeCambodiaCameroonCanadaCaribbean small statesCentral Europe and the BalticsChadChileColombiaComorosCongo, Dem. Rep.Congo, Rep.Costa RicaCote d'IvoireCroatiaCubaCyprusCzech RepublicDenmarkDjiboutiDominican RepublicEarly-demographic dividendEast Asia & PacificEcuadorEgypt, Arab Rep.El SalvadorEquatorial GuineaEritreaEstoniaEthiopiaEuro areaEurope & Central AsiaEurope & Central Asia (excluding high income)Europe & Central Asia (IDA & IBRD countries)European UnionFijiFinlandFranceGabonGambia, TheGeorgiaGermanyGhanaGreeceGuatemalaGuineaGuinea-BissauHaitiHeavily indebted poor countries (HIPC)High incomeHondurasHong Kong SAR, ChinaHungaryIBRD onlyIcelandIDA & IBRD totalIDA blendIDA onlyIDA totalIndiaIndonesiaIran, Islamic Rep.IrelandIsraelItalyJamaicaJapanJordanKazakhstanKenyaKorea, Rep.KosovoKuwaitKyrgyz RepublicLao PDRLatin America & Caribbean Latin America & Caribbean (excluding high income)Latin America & the Caribbean (IDA & IBRD countries)LatviaLeast developed countries: UN classificationLebanonLiberiaLithuaniaLow & middle incomeLow incomeLower middle incomeLuxembourgMacao SAR, ChinaMacedonia, FYRMadagascarMalawiMalaysiaMaliMaltaMauritaniaMauritiusMexicoMiddle East & North AfricaMiddle East & North Africa (excluding high income)Middle East & North Africa (IDA & IBRD countries)Middle incomeMoldovaMongoliaMontenegroMoroccoMozambiqueNamibiaNepalNetherlandsNew ZealandNicaraguaNigerNigeriaNorth AmericaNorwayOECD membersOmanOther small statesPakistanPanamaPapua New GuineaParaguayPeruPhilippinesPolandPortugalPost-demographic dividendPre-demographic dividendPuerto RicoQatarRomaniaRussian FederationRwandaSaudi ArabiaSenegalSerbiaSeychellesSierra LeoneSingaporeSlovak RepublicSloveniaSmall statesSomaliaSouth AfricaSouth AsiaSouth Asia (IDA & IBRD)South SudanSpainSri LankaSub-Saharan Africa Sub-Saharan Africa (excluding high income)Sub-Saharan Africa (IDA & IBRD countries)SudanSurinameSwazilandSwedenSwitzerlandSyrian Arab RepublicTajikistanTanzaniaThailandTimor-LesteTogoTrinidad and TobagoTunisiaTurkeyTurkmenistanUgandaUkraineUnited Arab EmiratesUnited KingdomUnited StatesUpper middle incomeUruguayUzbekistanVanuatuVenezuela, RBVietnamWest Bank and GazaWorldZimbabwe Timeline:
This timeline shows a graph from 1962 to 2016 of Cameroon. No data until 1961. Number of actual observations by date: 55.
Source name:
World Development Indicators
Source organization:
World Bank national accounts data, and OECD National Accounts data files.
Categories, topics:
Economy & Growth
Last updated:
apr 23, 2017
Indicators value changes by year
Minimum:
-12.025
jan 1, 1968
Maximum:
21.962
jan 1, 1987
At the date of observation
Value
Absolute change
Change from previous value
jan 1, 1962
1.44
+1.44
0.0%
jan 1, 1963
3.201
+1.761
122.31%
jan 1, 1964
3.789
+0.588
18.38%
jan 1, 1965
2.662
-1.127
-29.75%
jan 1, 1966
-1.416
-4.078
-153.2%
jan 1, 1967
2.19
+3.607
-254.66%
jan 1, 1968
-12.025
-14.216
-649.01%
jan 1, 1969
9.21
+21.236
-176.59%
jan 1, 1970
4.927
-4.283
-46.5%
jan 1, 1971
-1.703
-6.63
-134.55%
jan 1, 1972
3.152
+4.854
-285.12%
jan 1, 1973
0.374
-2.778
-88.13%
jan 1, 1974
2.544
+2.17
579.95%
jan 1, 1975
14.115
+11.571
454.89%
jan 1, 1976
12.62
-1.495
-10.59%
jan 1, 1977
-5.614
-18.235
-144.48%
jan 1, 1978
11.645
+17.259
-307.42%
jan 1, 1979
10.666
-0.979
-8.4%
jan 1, 1980
9.112
-1.554
-14.57%
jan 1, 1981
-11.924
-21.036
-230.85%
jan 1, 1982
7.877
+19.801
-166.06%
jan 1, 1983
17.183
+9.306
118.14%
jan 1, 1984
2.1
-15.084
-87.78%
jan 1, 1985
1.617
-0.483
-23.0%
jan 1, 1986
5.47
+3.853
238.35%
jan 1, 1987
21.962
+16.492
301.5%
jan 1, 1988
5.754
-16.208
-73.8%
jan 1, 1989
-5.521
-11.276
-195.95%
jan 1, 1990
-4.444
+1.077
-19.51%
jan 1, 1991
-4.111
+0.333
-7.49%
jan 1, 1992
-1.7
+2.411
-58.65%
jan 1, 1993
-5.648
-3.948
232.2%
jan 1, 1994
2.998
+8.645
-153.08%
jan 1, 1995
0.379
-2.618
-87.34%
jan 1, 1996
2.035
+1.655
436.39%
jan 1, 1997
4.945
+2.911
143.05%
jan 1, 1998
5.808
+0.862
17.44%
jan 1, 1999
4.531
-1.277
-21.99%
jan 1, 2000
4.551
+0.02
0.44%
jan 1, 2001
4.249
-0.301
-6.62%
jan 1, 2002
3.841
-0.409
-9.62%
jan 1, 2003
4.171
+0.33
8.59%
jan 1, 2004
5.685
+1.514
36.31%
jan 1, 2005
3.274
-2.41
-42.4%
jan 1, 2006
2.844
-0.43
-13.14%
jan 1, 2007
3.658
+0.814
28.61%
jan 1, 2008
5.146
+1.488
40.67%
jan 1, 2009
3.567
-1.578
-30.67%
jan 1, 2010
3.277
-0.29
-8.13%
jan 1, 2011
5.026
+1.748
53.35%
jan 1, 2012
5.349
+0.324
6.44%
jan 1, 2013
5.445
+0.095
1.78%
jan 1, 2014
5.63
+0.185
3.4%
jan 1, 2015
5.896
+0.266
4.72%
jan 1, 2016
5.801
-0.094
-1.6%
Ranking of countries by current statistics by years


Comments: