29
/
en
AIzaSyAYiBZKx7MnpbEhh9jyipgxe19OcubqV5w
April 1, 2024
29824
Euro area
EMU
false
2
1
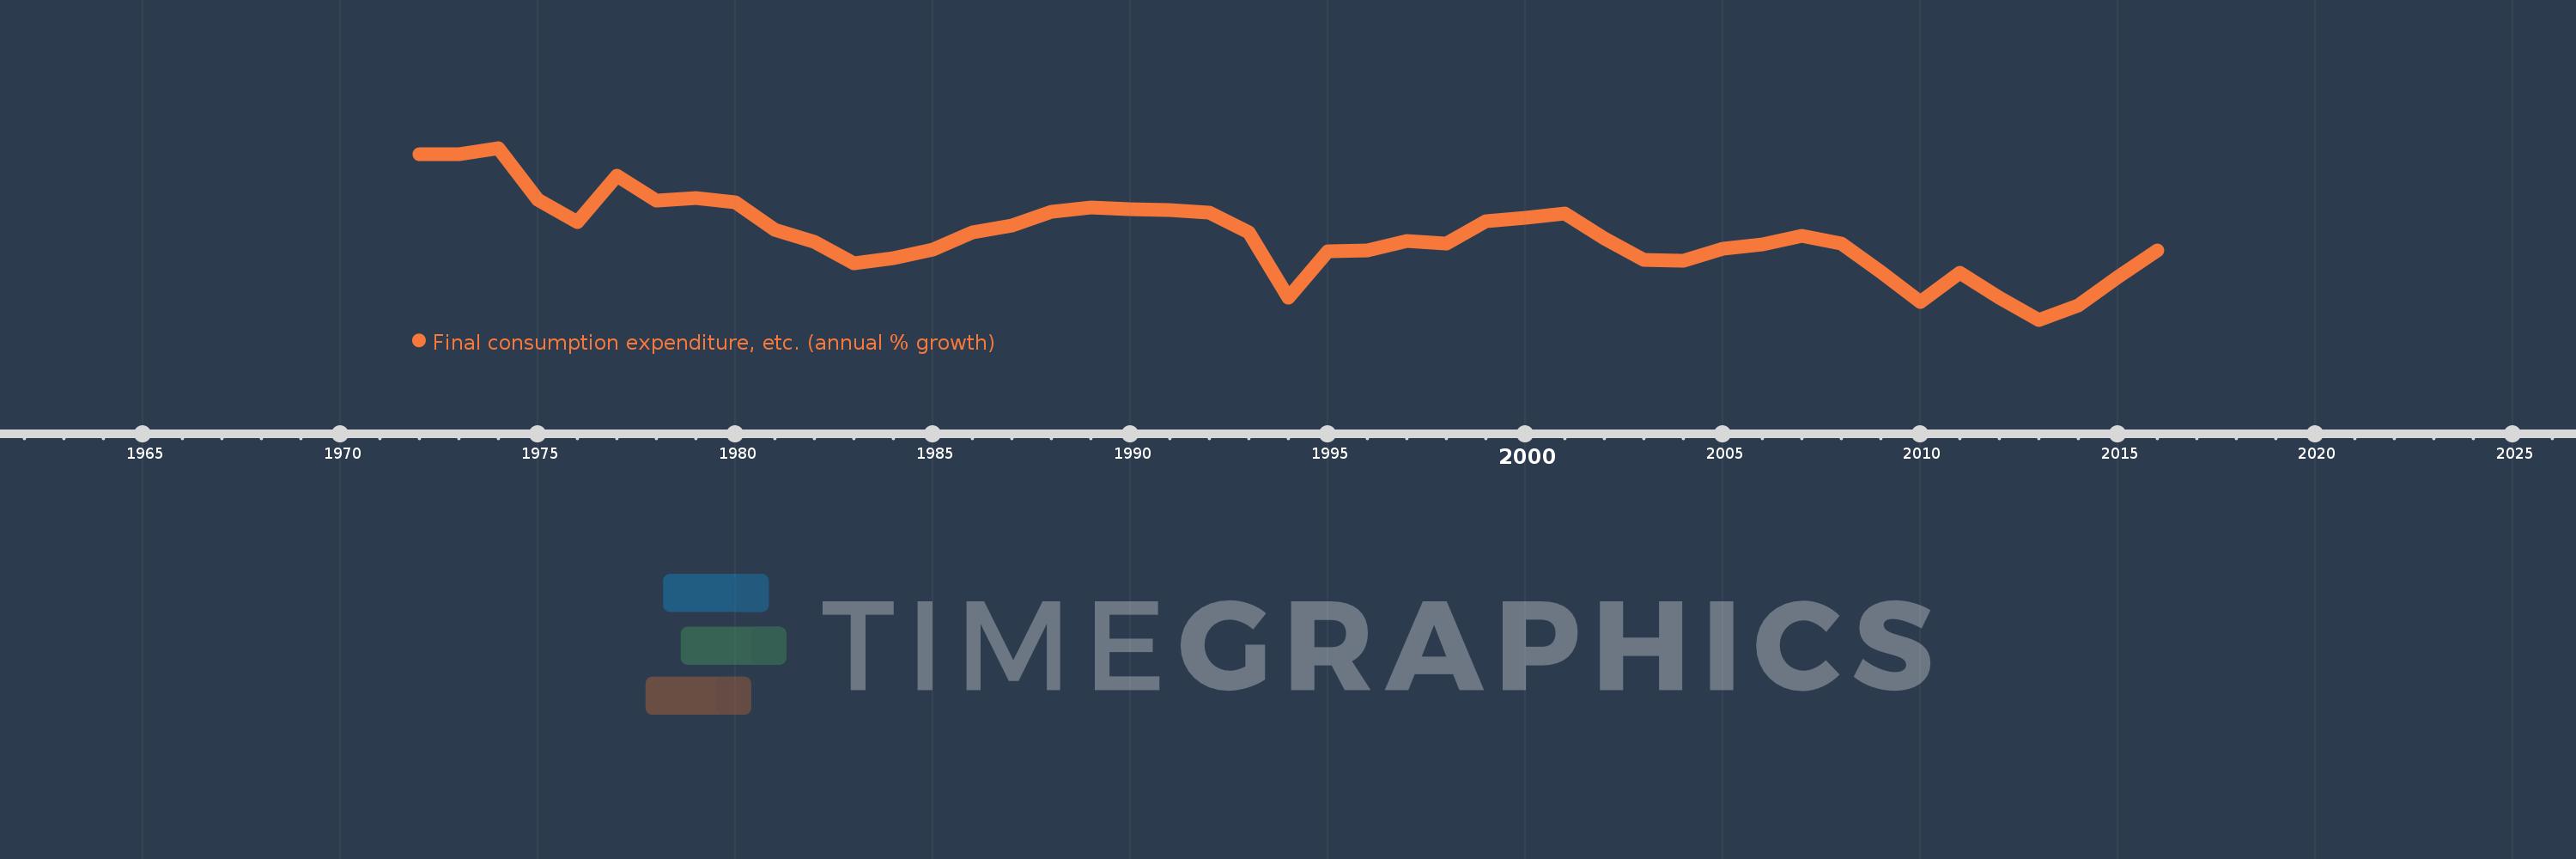
Final consumption expenditure, etc. (annual % growth)
2016,2015,2014,2013,2012,2011,2010,2009,2008,2007,2006,2005,2004,2003,2002,2001,2000,1999,1998,1997,1996,1995,1994,1993,1992,1991,1990,1989,1988,1987,1986,1985,1984,1983,1982,1981,1980,1979,1978,1977,1976,1975,1974,1973,1972
This statistics in other country:
AlbaniaAlgeriaAntigua and BarbudaArab WorldArgentinaArmeniaAustraliaAustriaAzerbaijanBahamas, TheBahrainBangladeshBarbadosBelarusBelgiumBelizeBeninBhutanBoliviaBosnia and HerzegovinaBotswanaBrazilBrunei DarussalamBulgariaBurkina FasoBurundiCabo VerdeCambodiaCameroonCanadaCaribbean small statesCentral Europe and the BalticsChadChileColombiaComorosCongo, Dem. Rep.Congo, Rep.Costa RicaCote d'IvoireCroatiaCubaCyprusCzech RepublicDenmarkDjiboutiDominican RepublicEarly-demographic dividendEast Asia & PacificEcuadorEgypt, Arab Rep.El SalvadorEquatorial GuineaEritreaEstoniaEthiopiaEuro areaEurope & Central AsiaEurope & Central Asia (excluding high income)Europe & Central Asia (IDA & IBRD countries)European UnionFijiFinlandFranceGabonGambia, TheGeorgiaGermanyGhanaGreeceGuatemalaGuineaGuinea-BissauHaitiHeavily indebted poor countries (HIPC)High incomeHondurasHong Kong SAR, ChinaHungaryIBRD onlyIcelandIDA & IBRD totalIDA blendIDA onlyIDA totalIndiaIndonesiaIran, Islamic Rep.IrelandIsraelItalyJamaicaJapanJordanKazakhstanKenyaKorea, Rep.KosovoKuwaitKyrgyz RepublicLao PDRLatin America & Caribbean Latin America & Caribbean (excluding high income)Latin America & the Caribbean (IDA & IBRD countries)LatviaLeast developed countries: UN classificationLebanonLiberiaLithuaniaLow & middle incomeLow incomeLower middle incomeLuxembourgMacao SAR, ChinaMacedonia, FYRMadagascarMalawiMalaysiaMaliMaltaMauritaniaMauritiusMexicoMiddle East & North AfricaMiddle East & North Africa (excluding high income)Middle East & North Africa (IDA & IBRD countries)Middle incomeMoldovaMongoliaMontenegroMoroccoMozambiqueNamibiaNepalNetherlandsNew ZealandNicaraguaNigerNigeriaNorth AmericaNorwayOECD membersOmanOther small statesPakistanPanamaPapua New GuineaParaguayPeruPhilippinesPolandPortugalPost-demographic dividendPre-demographic dividendPuerto RicoQatarRomaniaRussian FederationRwandaSaudi ArabiaSenegalSerbiaSeychellesSierra LeoneSingaporeSlovak RepublicSloveniaSmall statesSomaliaSouth AfricaSouth AsiaSouth Asia (IDA & IBRD)South SudanSpainSri LankaSub-Saharan Africa Sub-Saharan Africa (excluding high income)Sub-Saharan Africa (IDA & IBRD countries)SudanSurinameSwazilandSwedenSwitzerlandSyrian Arab RepublicTajikistanTanzaniaThailandTimor-LesteTogoTrinidad and TobagoTunisiaTurkeyTurkmenistanUgandaUkraineUnited Arab EmiratesUnited KingdomUnited StatesUpper middle incomeUruguayUzbekistanVanuatuVenezuela, RBVietnamWest Bank and GazaWorldZimbabwe Timeline:
This timeline shows a graph from 1972 to 2016 of Euro area. No data until 1971. Number of actual observations by date: 45.
Source name:
World Development Indicators
Source organization:
World Bank national accounts data, and OECD National Accounts data files.
Categories, topics:
Economy & Growth
Last updated:
apr 23, 2017
Indicators value changes by year
Minimum:
-0.878
jan 1, 2013
At the date of observation
Value
Absolute change
Change from previous value
jan 1, 1972
5.184
+5.184
0.0%
jan 1, 1973
5.176
-0.008
-0.15%
jan 1, 1974
5.41
+0.234
4.52%
jan 1, 1975
3.518
-1.893
-34.98%
jan 1, 1976
2.7
-0.818
-23.25%
jan 1, 1977
4.387
+1.687
62.49%
jan 1, 1978
3.486
-0.901
-20.53%
jan 1, 1979
3.591
+0.105
3.01%
jan 1, 1980
3.432
-0.159
-4.43%
jan 1, 1981
2.402
-1.03
-30.01%
jan 1, 1982
1.959
-0.443
-18.45%
jan 1, 1983
1.172
-0.787
-40.17%
jan 1, 1984
1.386
+0.214
18.24%
jan 1, 1985
1.683
+0.297
21.42%
jan 1, 1986
2.312
+0.629
37.38%
jan 1, 1987
2.577
+0.265
11.47%
jan 1, 1988
3.063
+0.486
18.87%
jan 1, 1989
3.221
+0.158
5.16%
jan 1, 1990
3.164
-0.058
-1.79%
jan 1, 1991
3.152
-0.011
-0.36%
jan 1, 1992
3.034
-0.118
-3.75%
jan 1, 1993
2.316
-0.718
-23.68%
jan 1, 1994
-0.057
-2.373
-102.46%
jan 1, 1995
1.627
+1.684
-2.95K%
jan 1, 1996
1.66
+0.033
2.01%
jan 1, 1997
2.011
+0.351
21.14%
jan 1, 1998
1.898
-0.113
-5.61%
jan 1, 1999
2.728
+0.831
43.76%
jan 1, 2000
2.866
+0.137
5.02%
jan 1, 2001
3.014
+0.148
5.17%
jan 1, 2002
2.1
-0.914
-30.32%
jan 1, 2003
1.303
-0.797
-37.94%
jan 1, 2004
1.291
-0.012
-0.9%
jan 1, 2005
1.716
+0.425
32.9%
jan 1, 2006
1.87
+0.154
8.96%
jan 1, 2007
2.198
+0.328
17.54%
jan 1, 2008
1.9
-0.298
-13.58%
jan 1, 2009
0.863
-1.037
-54.58%
jan 1, 2010
-0.236
-1.099
-127.34%
jan 1, 2011
0.841
+1.076
-456.26%
jan 1, 2012
-0.085
-0.926
-110.14%
jan 1, 2013
-0.878
-0.793
930.43%
jan 1, 2014
-0.361
+0.517
-58.89%
jan 1, 2015
0.7
+1.061
-293.88%
jan 1, 2016
1.668
+0.968
138.22%
Ranking of countries by current statistics by years


Comments: