29
/
en
AIzaSyAYiBZKx7MnpbEhh9jyipgxe19OcubqV5w
April 1, 2024
27251
East Asia & Pacific
EAS
false
2
1
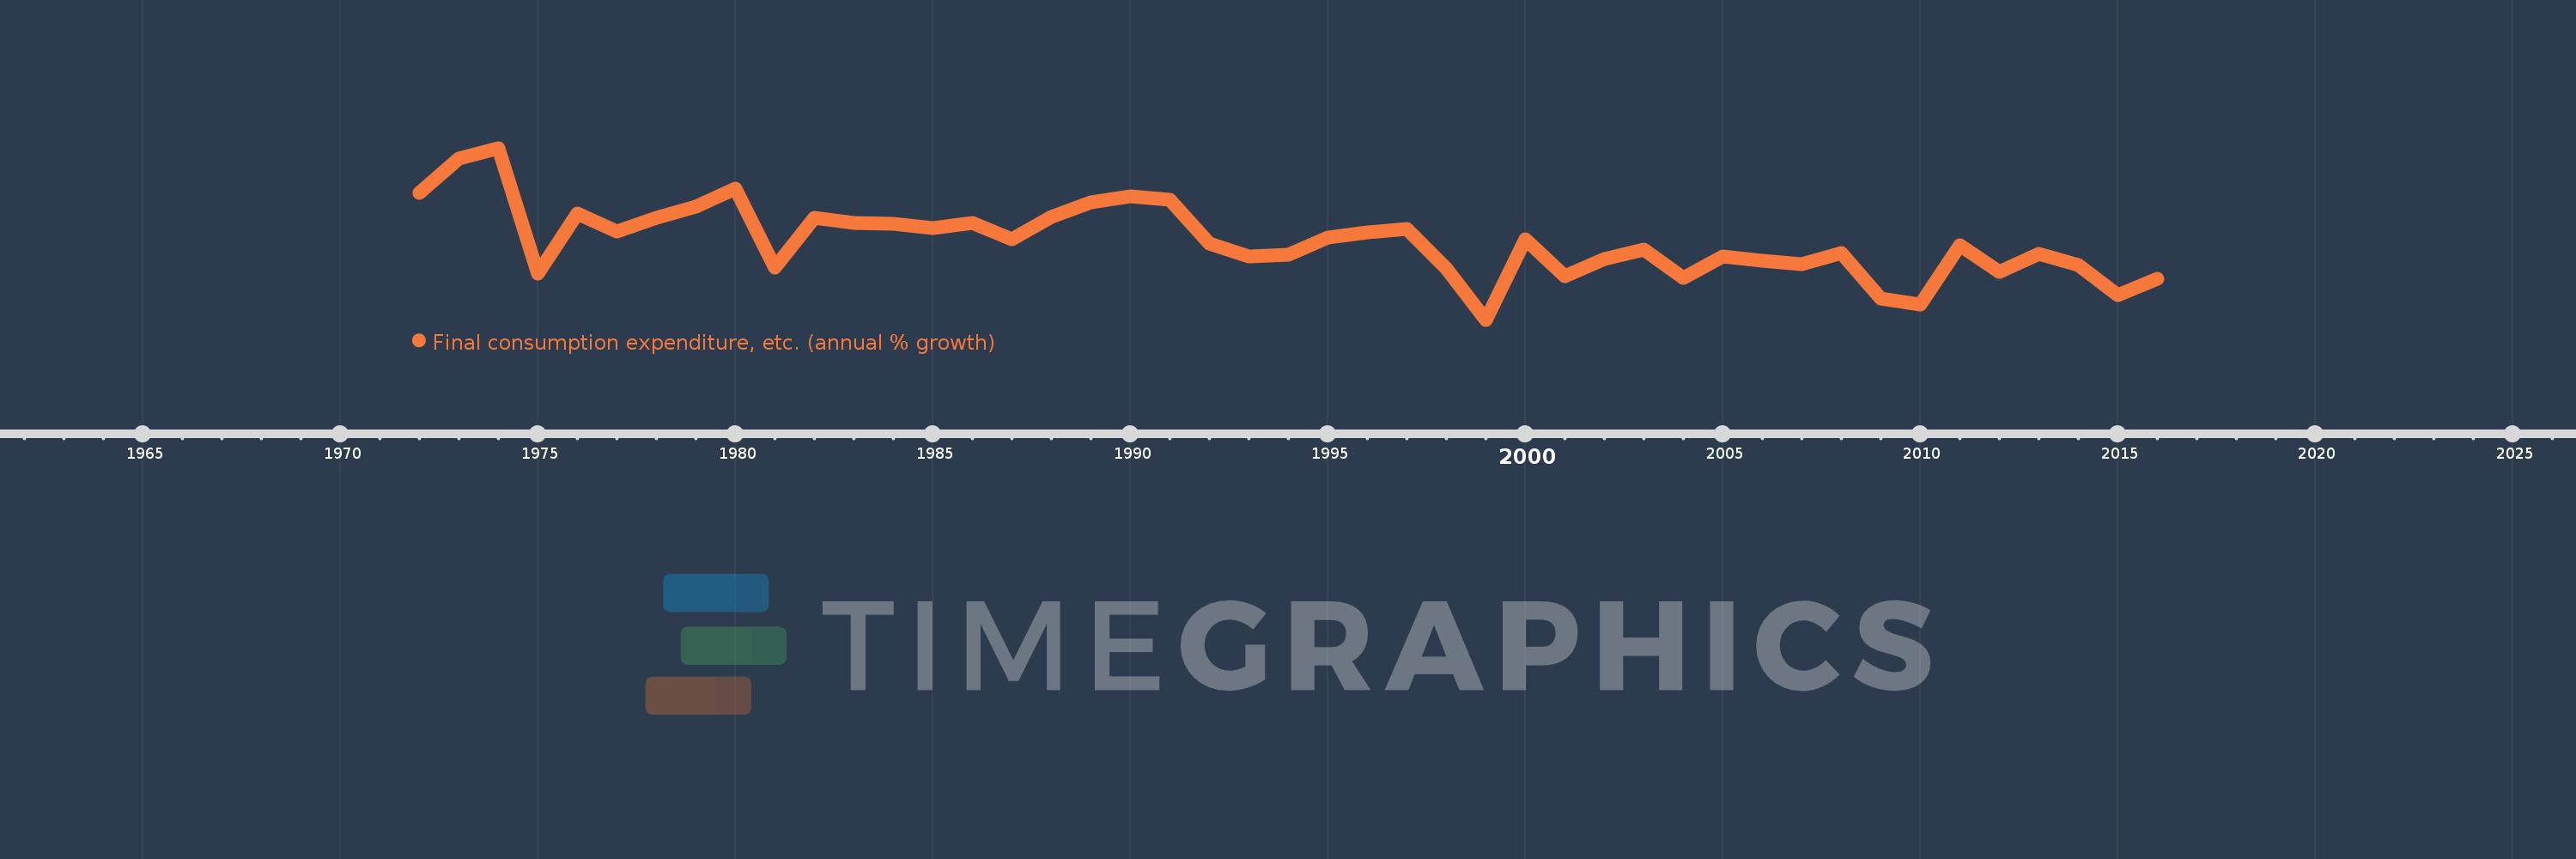
Final consumption expenditure, etc. (annual % growth)
2016,2015,2014,2013,2012,2011,2010,2009,2008,2007,2006,2005,2004,2003,2002,2001,2000,1999,1998,1997,1996,1995,1994,1993,1992,1991,1990,1989,1988,1987,1986,1985,1984,1983,1982,1981,1980,1979,1978,1977,1976,1975,1974,1973,1972
This statistics in other country:
AlbaniaAlgeriaAntigua and BarbudaArab WorldArgentinaArmeniaAustraliaAustriaAzerbaijanBahamas, TheBahrainBangladeshBarbadosBelarusBelgiumBelizeBeninBhutanBoliviaBosnia and HerzegovinaBotswanaBrazilBrunei DarussalamBulgariaBurkina FasoBurundiCabo VerdeCambodiaCameroonCanadaCaribbean small statesCentral Europe and the BalticsChadChileColombiaComorosCongo, Dem. Rep.Congo, Rep.Costa RicaCote d'IvoireCroatiaCubaCyprusCzech RepublicDenmarkDjiboutiDominican RepublicEarly-demographic dividendEast Asia & PacificEcuadorEgypt, Arab Rep.El SalvadorEquatorial GuineaEritreaEstoniaEthiopiaEuro areaEurope & Central AsiaEurope & Central Asia (excluding high income)Europe & Central Asia (IDA & IBRD countries)European UnionFijiFinlandFranceGabonGambia, TheGeorgiaGermanyGhanaGreeceGuatemalaGuineaGuinea-BissauHaitiHeavily indebted poor countries (HIPC)High incomeHondurasHong Kong SAR, ChinaHungaryIBRD onlyIcelandIDA & IBRD totalIDA blendIDA onlyIDA totalIndiaIndonesiaIran, Islamic Rep.IrelandIsraelItalyJamaicaJapanJordanKazakhstanKenyaKorea, Rep.KosovoKuwaitKyrgyz RepublicLao PDRLatin America & Caribbean Latin America & Caribbean (excluding high income)Latin America & the Caribbean (IDA & IBRD countries)LatviaLeast developed countries: UN classificationLebanonLiberiaLithuaniaLow & middle incomeLow incomeLower middle incomeLuxembourgMacao SAR, ChinaMacedonia, FYRMadagascarMalawiMalaysiaMaliMaltaMauritaniaMauritiusMexicoMiddle East & North AfricaMiddle East & North Africa (excluding high income)Middle East & North Africa (IDA & IBRD countries)Middle incomeMoldovaMongoliaMontenegroMoroccoMozambiqueNamibiaNepalNetherlandsNew ZealandNicaraguaNigerNigeriaNorth AmericaNorwayOECD membersOmanOther small statesPakistanPanamaPapua New GuineaParaguayPeruPhilippinesPolandPortugalPost-demographic dividendPre-demographic dividendPuerto RicoQatarRomaniaRussian FederationRwandaSaudi ArabiaSenegalSerbiaSeychellesSierra LeoneSingaporeSlovak RepublicSloveniaSmall statesSomaliaSouth AfricaSouth AsiaSouth Asia (IDA & IBRD)South SudanSpainSri LankaSub-Saharan Africa Sub-Saharan Africa (excluding high income)Sub-Saharan Africa (IDA & IBRD countries)SudanSurinameSwazilandSwedenSwitzerlandSyrian Arab RepublicTajikistanTanzaniaThailandTimor-LesteTogoTrinidad and TobagoTunisiaTurkeyTurkmenistanUgandaUkraineUnited Arab EmiratesUnited KingdomUnited StatesUpper middle incomeUruguayUzbekistanVanuatuVenezuela, RBVietnamWest Bank and GazaWorldZimbabwe Timeline:
This timeline shows a graph from 1972 to 2016 of East Asia & Pacific. No data until 1971. Number of actual observations by date: 45.
Source name:
World Development Indicators
Source organization:
World Bank national accounts data, and OECD National Accounts data files.
Categories, topics:
Economy & Growth
Last updated:
apr 23, 2017
Indicators value changes by year
Minimum:
-0.087
jan 1, 1999
At the date of observation
Value
Absolute change
Change from previous value
jan 1, 1972
5.631
+5.631
0.0%
jan 1, 1973
7.182
+1.552
27.56%
jan 1, 1974
7.649
+0.467
6.5%
jan 1, 1975
1.974
-5.675
-74.2%
jan 1, 1976
4.715
+2.742
138.92%
jan 1, 1977
3.896
-0.819
-17.37%
jan 1, 1978
4.513
+0.617
15.83%
jan 1, 1979
5.023
+0.511
11.32%
jan 1, 1980
5.806
+0.783
15.58%
jan 1, 1981
2.253
-3.553
-61.19%
jan 1, 1982
4.502
+2.249
99.82%
jan 1, 1983
4.257
-0.245
-5.45%
jan 1, 1984
4.218
-0.039
-0.91%
jan 1, 1985
4.05
-0.168
-3.99%
jan 1, 1986
4.28
+0.23
5.69%
jan 1, 1987
3.519
-0.761
-17.79%
jan 1, 1988
4.54
+1.021
29.03%
jan 1, 1989
5.202
+0.661
14.57%
jan 1, 1990
5.463
+0.261
5.01%
jan 1, 1991
5.302
-0.16
-2.94%
jan 1, 1992
3.328
-1.974
-37.24%
jan 1, 1993
2.746
-0.582
-17.48%
jan 1, 1994
2.836
+0.09
3.27%
jan 1, 1995
3.609
+0.774
27.28%
jan 1, 1996
3.862
+0.253
7.01%
jan 1, 1997
3.993
+0.13
3.37%
jan 1, 1998
2.208
-1.784
-44.69%
jan 1, 1999
-0.087
-2.295
-103.95%
jan 1, 2000
3.551
+3.638
-4.17K%
jan 1, 2001
1.882
-1.669
-47.0%
jan 1, 2002
2.642
+0.76
40.4%
jan 1, 2003
3.054
+0.412
15.59%
jan 1, 2004
1.785
-1.27
-41.56%
jan 1, 2005
2.771
+0.986
55.26%
jan 1, 2006
2.559
-0.213
-7.67%
jan 1, 2007
2.415
-0.144
-5.62%
jan 1, 2008
2.922
+0.508
21.02%
jan 1, 2009
0.882
-2.041
-69.84%
jan 1, 2010
0.596
-0.285
-32.34%
jan 1, 2011
3.272
+2.676
448.65%
jan 1, 2012
2.055
-1.217
-37.2%
jan 1, 2013
2.867
+0.812
39.53%
jan 1, 2014
2.363
-0.505
-17.6%
jan 1, 2015
1.031
-1.332
-56.38%
jan 1, 2016
1.76
+0.73
70.83%
Ranking of countries by current statistics by years


Comments: