29
/
en
AIzaSyAYiBZKx7MnpbEhh9jyipgxe19OcubqV5w
April 1, 2024
104829
Chile
CHL
true
2
1
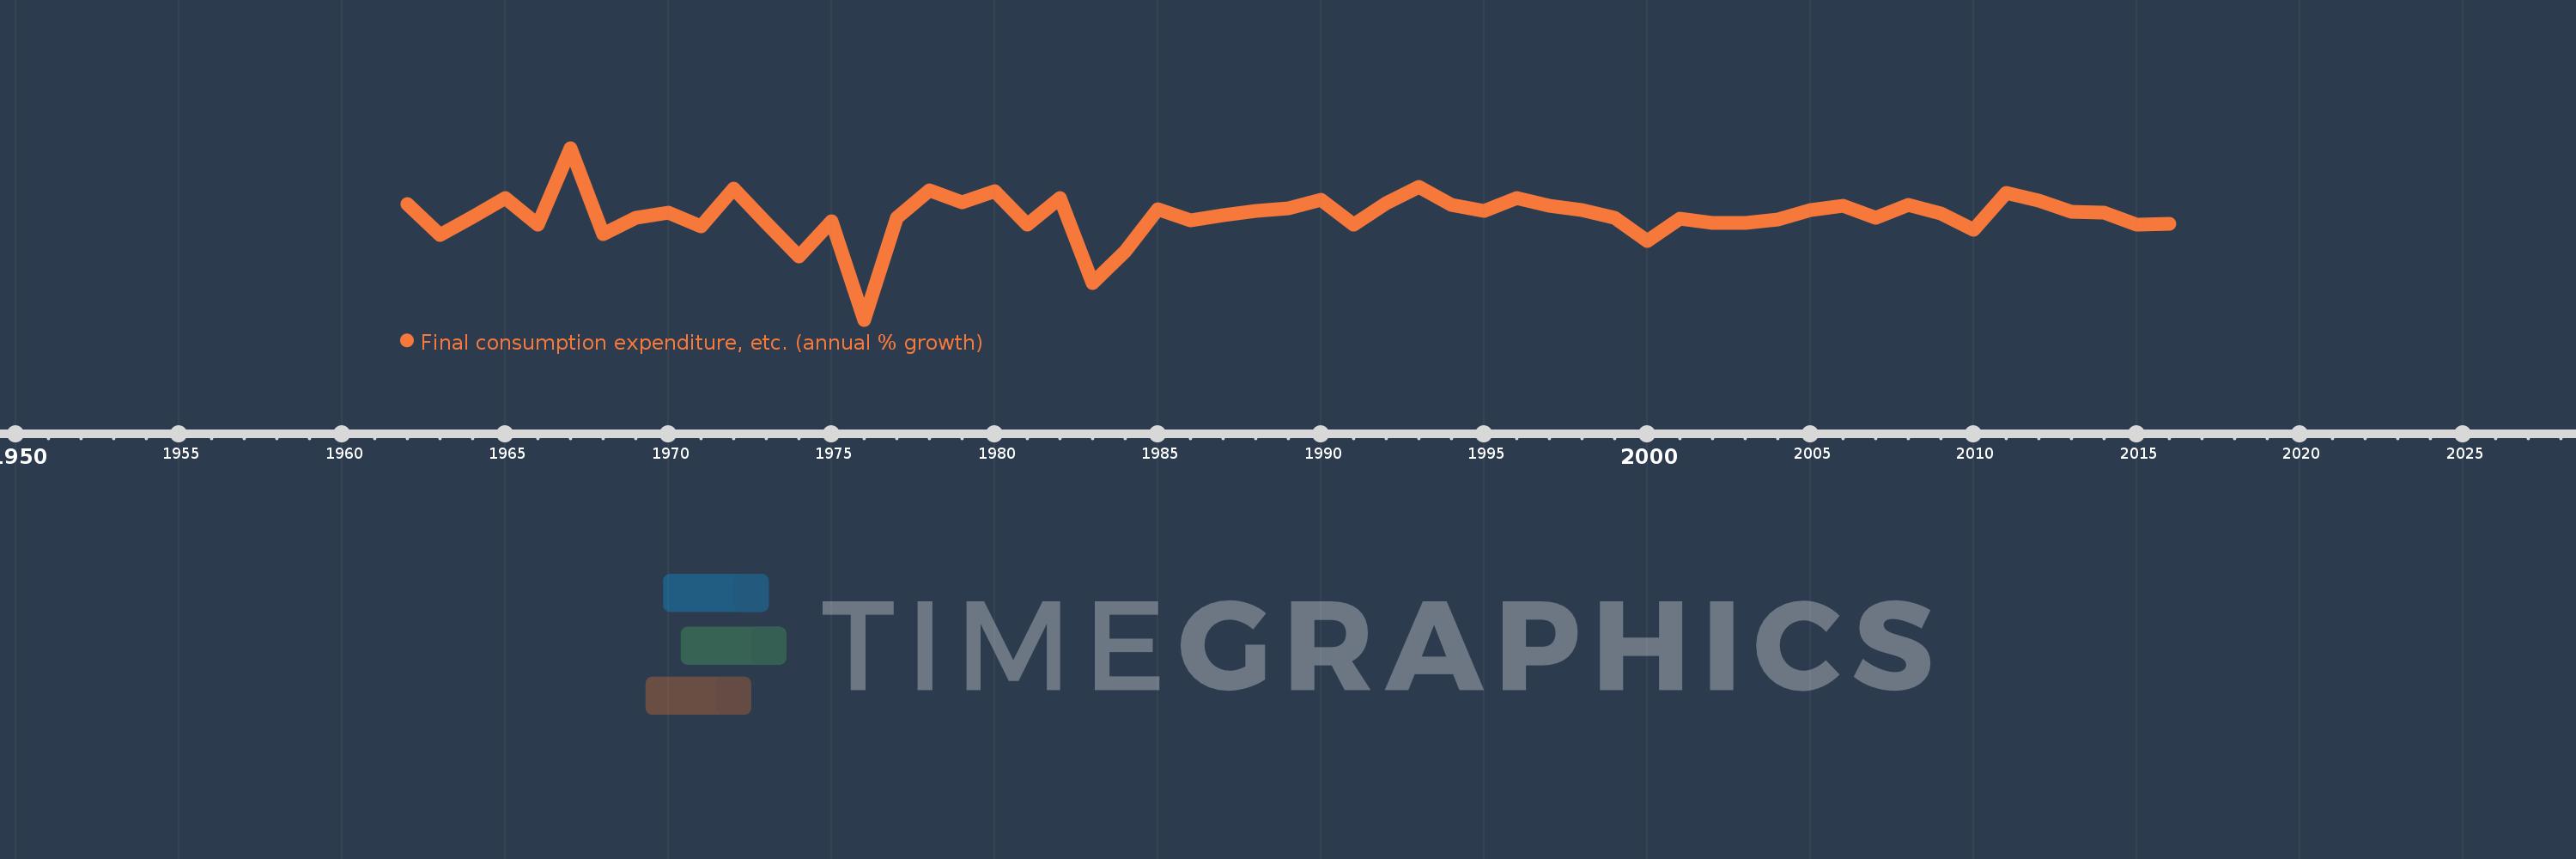
Final consumption expenditure, etc. (annual % growth)
2016,2015,2014,2013,2012,2011,2010,2009,2008,2007,2006,2005,2004,2003,2002,2001,2000,1999,1998,1997,1996,1995,1994,1993,1992,1991,1990,1989,1988,1987,1986,1985,1984,1983,1982,1981,1980,1979,1978,1977,1976,1975,1974,1973,1972,1971,1970,1969,1968,1967,1966,1965,1964,1963,1962
This statistics in other country:
AlbaniaAlgeriaAntigua and BarbudaArab WorldArgentinaArmeniaAustraliaAustriaAzerbaijanBahamas, TheBahrainBangladeshBarbadosBelarusBelgiumBelizeBeninBhutanBoliviaBosnia and HerzegovinaBotswanaBrazilBrunei DarussalamBulgariaBurkina FasoBurundiCabo VerdeCambodiaCameroonCanadaCaribbean small statesCentral Europe and the BalticsChadChileColombiaComorosCongo, Dem. Rep.Congo, Rep.Costa RicaCote d'IvoireCroatiaCubaCyprusCzech RepublicDenmarkDjiboutiDominican RepublicEarly-demographic dividendEast Asia & PacificEcuadorEgypt, Arab Rep.El SalvadorEquatorial GuineaEritreaEstoniaEthiopiaEuro areaEurope & Central AsiaEurope & Central Asia (excluding high income)Europe & Central Asia (IDA & IBRD countries)European UnionFijiFinlandFranceGabonGambia, TheGeorgiaGermanyGhanaGreeceGuatemalaGuineaGuinea-BissauHaitiHeavily indebted poor countries (HIPC)High incomeHondurasHong Kong SAR, ChinaHungaryIBRD onlyIcelandIDA & IBRD totalIDA blendIDA onlyIDA totalIndiaIndonesiaIran, Islamic Rep.IrelandIsraelItalyJamaicaJapanJordanKazakhstanKenyaKorea, Rep.KosovoKuwaitKyrgyz RepublicLao PDRLatin America & Caribbean Latin America & Caribbean (excluding high income)Latin America & the Caribbean (IDA & IBRD countries)LatviaLeast developed countries: UN classificationLebanonLiberiaLithuaniaLow & middle incomeLow incomeLower middle incomeLuxembourgMacao SAR, ChinaMacedonia, FYRMadagascarMalawiMalaysiaMaliMaltaMauritaniaMauritiusMexicoMiddle East & North AfricaMiddle East & North Africa (excluding high income)Middle East & North Africa (IDA & IBRD countries)Middle incomeMoldovaMongoliaMontenegroMoroccoMozambiqueNamibiaNepalNetherlandsNew ZealandNicaraguaNigerNigeriaNorth AmericaNorwayOECD membersOmanOther small statesPakistanPanamaPapua New GuineaParaguayPeruPhilippinesPolandPortugalPost-demographic dividendPre-demographic dividendPuerto RicoQatarRomaniaRussian FederationRwandaSaudi ArabiaSenegalSerbiaSeychellesSierra LeoneSingaporeSlovak RepublicSloveniaSmall statesSomaliaSouth AfricaSouth AsiaSouth Asia (IDA & IBRD)South SudanSpainSri LankaSub-Saharan Africa Sub-Saharan Africa (excluding high income)Sub-Saharan Africa (IDA & IBRD countries)SudanSurinameSwazilandSwedenSwitzerlandSyrian Arab RepublicTajikistanTanzaniaThailandTimor-LesteTogoTrinidad and TobagoTunisiaTurkeyTurkmenistanUgandaUkraineUnited Arab EmiratesUnited KingdomUnited StatesUpper middle incomeUruguayUzbekistanVanuatuVenezuela, RBVietnamWest Bank and GazaWorldZimbabwe Timeline:
This timeline shows a graph from 1962 to 2016 of Chile. No data until 1961. Number of actual observations by date: 55.
Source name:
World Development Indicators
Source organization:
World Bank national accounts data, and OECD National Accounts data files.
Categories, topics:
Economy & Growth
Last updated:
apr 23, 2017
Indicators value changes by year
Minimum:
-22.661
jan 1, 1976
Maximum:
22.009
jan 1, 1967
At the date of observation
Value
Absolute change
Change from previous value
jan 1, 1962
7.326
+7.326
0.0%
jan 1, 1963
-0.68
-8.006
-109.29%
jan 1, 1964
4.05
+4.73
-695.33%
jan 1, 1965
9.017
+4.967
122.65%
jan 1, 1966
2.154
-6.863
-76.11%
jan 1, 1967
22.009
+19.855
921.78%
jan 1, 1968
-0.286
-22.296
-101.3%
jan 1, 1969
3.883
+4.17
-1.46K%
jan 1, 1970
5.249
+1.365
35.16%
jan 1, 1971
1.652
-3.597
-68.53%
jan 1, 1972
11.377
+9.725
588.85%
jan 1, 1973
2.611
-8.766
-77.05%
jan 1, 1974
-6.151
-8.762
-335.56%
jan 1, 1975
3.033
+9.184
-149.31%
jan 1, 1976
-22.661
-25.694
-847.16%
jan 1, 1977
3.901
+26.562
-117.21%
jan 1, 1978
11.034
+7.133
182.87%
jan 1, 1979
7.958
-3.076
-27.88%
jan 1, 1980
10.671
+2.713
34.09%
jan 1, 1981
2.032
-8.639
-80.96%
jan 1, 1982
9.099
+7.067
347.78%
jan 1, 1983
-13.21
-22.309
-245.18%
jan 1, 1984
-4.934
+8.276
-62.65%
jan 1, 1985
6.05
+10.984
-222.62%
jan 1, 1986
3.092
-2.959
-48.9%
jan 1, 1987
4.43
+1.339
43.3%
jan 1, 1988
5.643
+1.213
27.38%
jan 1, 1989
6.214
+0.57
10.1%
jan 1, 1990
8.616
+2.403
38.67%
jan 1, 1991
2.058
-6.558
-76.12%
jan 1, 1992
7.563
+5.505
267.52%
jan 1, 1993
11.868
+4.305
56.92%
jan 1, 1994
7.112
-4.756
-40.07%
jan 1, 1995
5.701
-1.411
-19.84%
jan 1, 1996
8.912
+3.211
56.32%
jan 1, 1997
7.065
-1.847
-20.72%
jan 1, 1998
5.912
-1.154
-16.33%
jan 1, 1999
3.807
-2.105
-35.6%
jan 1, 2000
-2.077
-5.883
-154.55%
jan 1, 2001
3.66
+5.737
-276.26%
jan 1, 2002
2.54
-1.12
-30.61%
jan 1, 2003
2.469
-0.071
-2.78%
jan 1, 2004
3.433
+0.964
39.03%
jan 1, 2005
5.889
+2.456
71.54%
jan 1, 2006
6.917
+1.028
17.46%
jan 1, 2007
3.908
-3.009
-43.51%
jan 1, 2008
7.261
+3.353
85.8%
jan 1, 2009
4.919
-2.342
-32.26%
jan 1, 2010
0.77
-4.149
-84.35%
jan 1, 2011
10.328
+9.558
1.24K%
jan 1, 2012
8.413
-1.915
-18.54%
jan 1, 2013
5.361
-3.053
-36.28%
jan 1, 2014
5.164
-0.196
-3.66%
jan 1, 2015
2.129
-3.035
-58.77%
jan 1, 2016
2.34
+0.211
9.91%
Ranking of countries by current statistics by years


Comments: