29
/
en
AIzaSyAYiBZKx7MnpbEhh9jyipgxe19OcubqV5w
April 1, 2024
25661
Central Europe and the Baltics
CEB
false
2
1
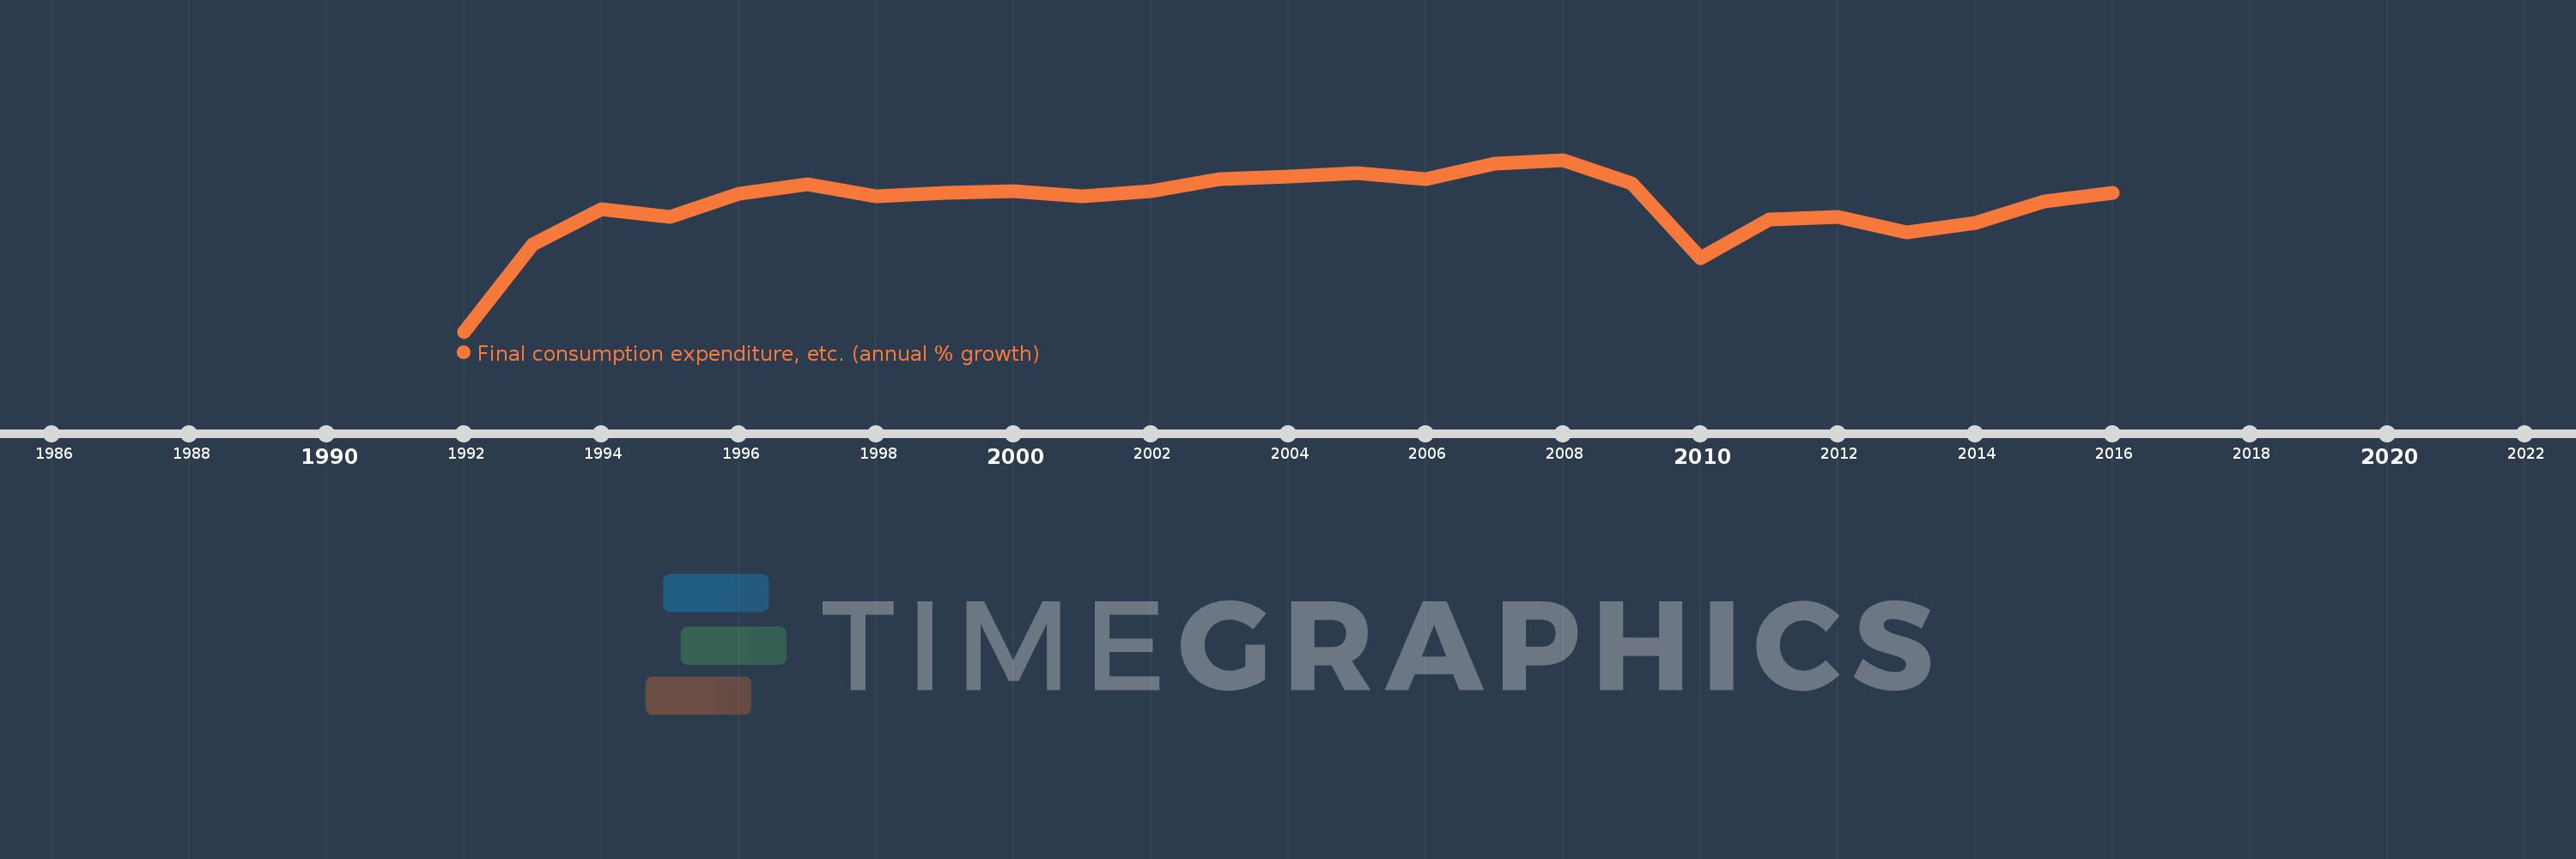
Final consumption expenditure, etc. (annual % growth)
2016,2015,2014,2013,2012,2011,2010,2009,2008,2007,2006,2005,2004,2003,2002,2001,2000,1999,1998,1997,1996,1995,1994,1993,1992
This statistics in other country:
AlbaniaAlgeriaAntigua and BarbudaArab WorldArgentinaArmeniaAustraliaAustriaAzerbaijanBahamas, TheBahrainBangladeshBarbadosBelarusBelgiumBelizeBeninBhutanBoliviaBosnia and HerzegovinaBotswanaBrazilBrunei DarussalamBulgariaBurkina FasoBurundiCabo VerdeCambodiaCameroonCanadaCaribbean small statesCentral Europe and the BalticsChadChileColombiaComorosCongo, Dem. Rep.Congo, Rep.Costa RicaCote d'IvoireCroatiaCubaCyprusCzech RepublicDenmarkDjiboutiDominican RepublicEarly-demographic dividendEast Asia & PacificEcuadorEgypt, Arab Rep.El SalvadorEquatorial GuineaEritreaEstoniaEthiopiaEuro areaEurope & Central AsiaEurope & Central Asia (excluding high income)Europe & Central Asia (IDA & IBRD countries)European UnionFijiFinlandFranceGabonGambia, TheGeorgiaGermanyGhanaGreeceGuatemalaGuineaGuinea-BissauHaitiHeavily indebted poor countries (HIPC)High incomeHondurasHong Kong SAR, ChinaHungaryIBRD onlyIcelandIDA & IBRD totalIDA blendIDA onlyIDA totalIndiaIndonesiaIran, Islamic Rep.IrelandIsraelItalyJamaicaJapanJordanKazakhstanKenyaKorea, Rep.KosovoKuwaitKyrgyz RepublicLao PDRLatin America & Caribbean Latin America & Caribbean (excluding high income)Latin America & the Caribbean (IDA & IBRD countries)LatviaLeast developed countries: UN classificationLebanonLiberiaLithuaniaLow & middle incomeLow incomeLower middle incomeLuxembourgMacao SAR, ChinaMacedonia, FYRMadagascarMalawiMalaysiaMaliMaltaMauritaniaMauritiusMexicoMiddle East & North AfricaMiddle East & North Africa (excluding high income)Middle East & North Africa (IDA & IBRD countries)Middle incomeMoldovaMongoliaMontenegroMoroccoMozambiqueNamibiaNepalNetherlandsNew ZealandNicaraguaNigerNigeriaNorth AmericaNorwayOECD membersOmanOther small statesPakistanPanamaPapua New GuineaParaguayPeruPhilippinesPolandPortugalPost-demographic dividendPre-demographic dividendPuerto RicoQatarRomaniaRussian FederationRwandaSaudi ArabiaSenegalSerbiaSeychellesSierra LeoneSingaporeSlovak RepublicSloveniaSmall statesSomaliaSouth AfricaSouth AsiaSouth Asia (IDA & IBRD)South SudanSpainSri LankaSub-Saharan Africa Sub-Saharan Africa (excluding high income)Sub-Saharan Africa (IDA & IBRD countries)SudanSurinameSwazilandSwedenSwitzerlandSyrian Arab RepublicTajikistanTanzaniaThailandTimor-LesteTogoTrinidad and TobagoTunisiaTurkeyTurkmenistanUgandaUkraineUnited Arab EmiratesUnited KingdomUnited StatesUpper middle incomeUruguayUzbekistanVanuatuVenezuela, RBVietnamWest Bank and GazaWorldZimbabwe Timeline:
This timeline shows a graph from 1992 to 2016 of Central Europe and the Baltics. No data until 1991. Number of actual observations by date: 25.
Source name:
World Development Indicators
Source organization:
World Bank national accounts data, and OECD National Accounts data files.
Categories, topics:
Economy & Growth
Last updated:
apr 23, 2017
Indicators value changes by year
Minimum:
-7.911
jan 1, 1992
At the date of observation
Value
Absolute change
Change from previous value
jan 1, 1992
-7.911
-7.911
0.0%
jan 1, 1993
-0.943
+6.968
-88.08%
jan 1, 1994
1.811
+2.754
-292.05%
jan 1, 1995
1.234
-0.577
-31.87%
jan 1, 1996
3.07
+1.836
148.78%
jan 1, 1997
3.834
+0.764
24.9%
jan 1, 1998
2.88
-0.954
-24.87%
jan 1, 1999
3.154
+0.273
9.49%
jan 1, 2000
3.254
+0.101
3.19%
jan 1, 2001
2.871
-0.383
-11.77%
jan 1, 2002
3.286
+0.415
14.45%
jan 1, 2003
4.262
+0.976
29.71%
jan 1, 2004
4.438
+0.176
4.13%
jan 1, 2005
4.742
+0.304
6.84%
jan 1, 2006
4.24
-0.502
-10.58%
jan 1, 2007
5.493
+1.253
29.56%
jan 1, 2008
5.779
+0.286
5.2%
jan 1, 2009
3.896
-1.883
-32.58%
jan 1, 2010
-2.062
-5.958
-152.92%
jan 1, 2011
0.995
+3.057
-148.24%
jan 1, 2012
1.201
+0.206
20.74%
jan 1, 2013
-0.034
-1.235
-102.84%
jan 1, 2014
0.724
+0.758
-2.22K%
jan 1, 2015
2.474
+1.75
241.79%
jan 1, 2016
3.135
+0.661
26.73%
Ranking of countries by current statistics by years


Comments: