29
/
en
AIzaSyAYiBZKx7MnpbEhh9jyipgxe19OcubqV5w
April 1, 2024
257272
Switzerland
CHE
true
2
1
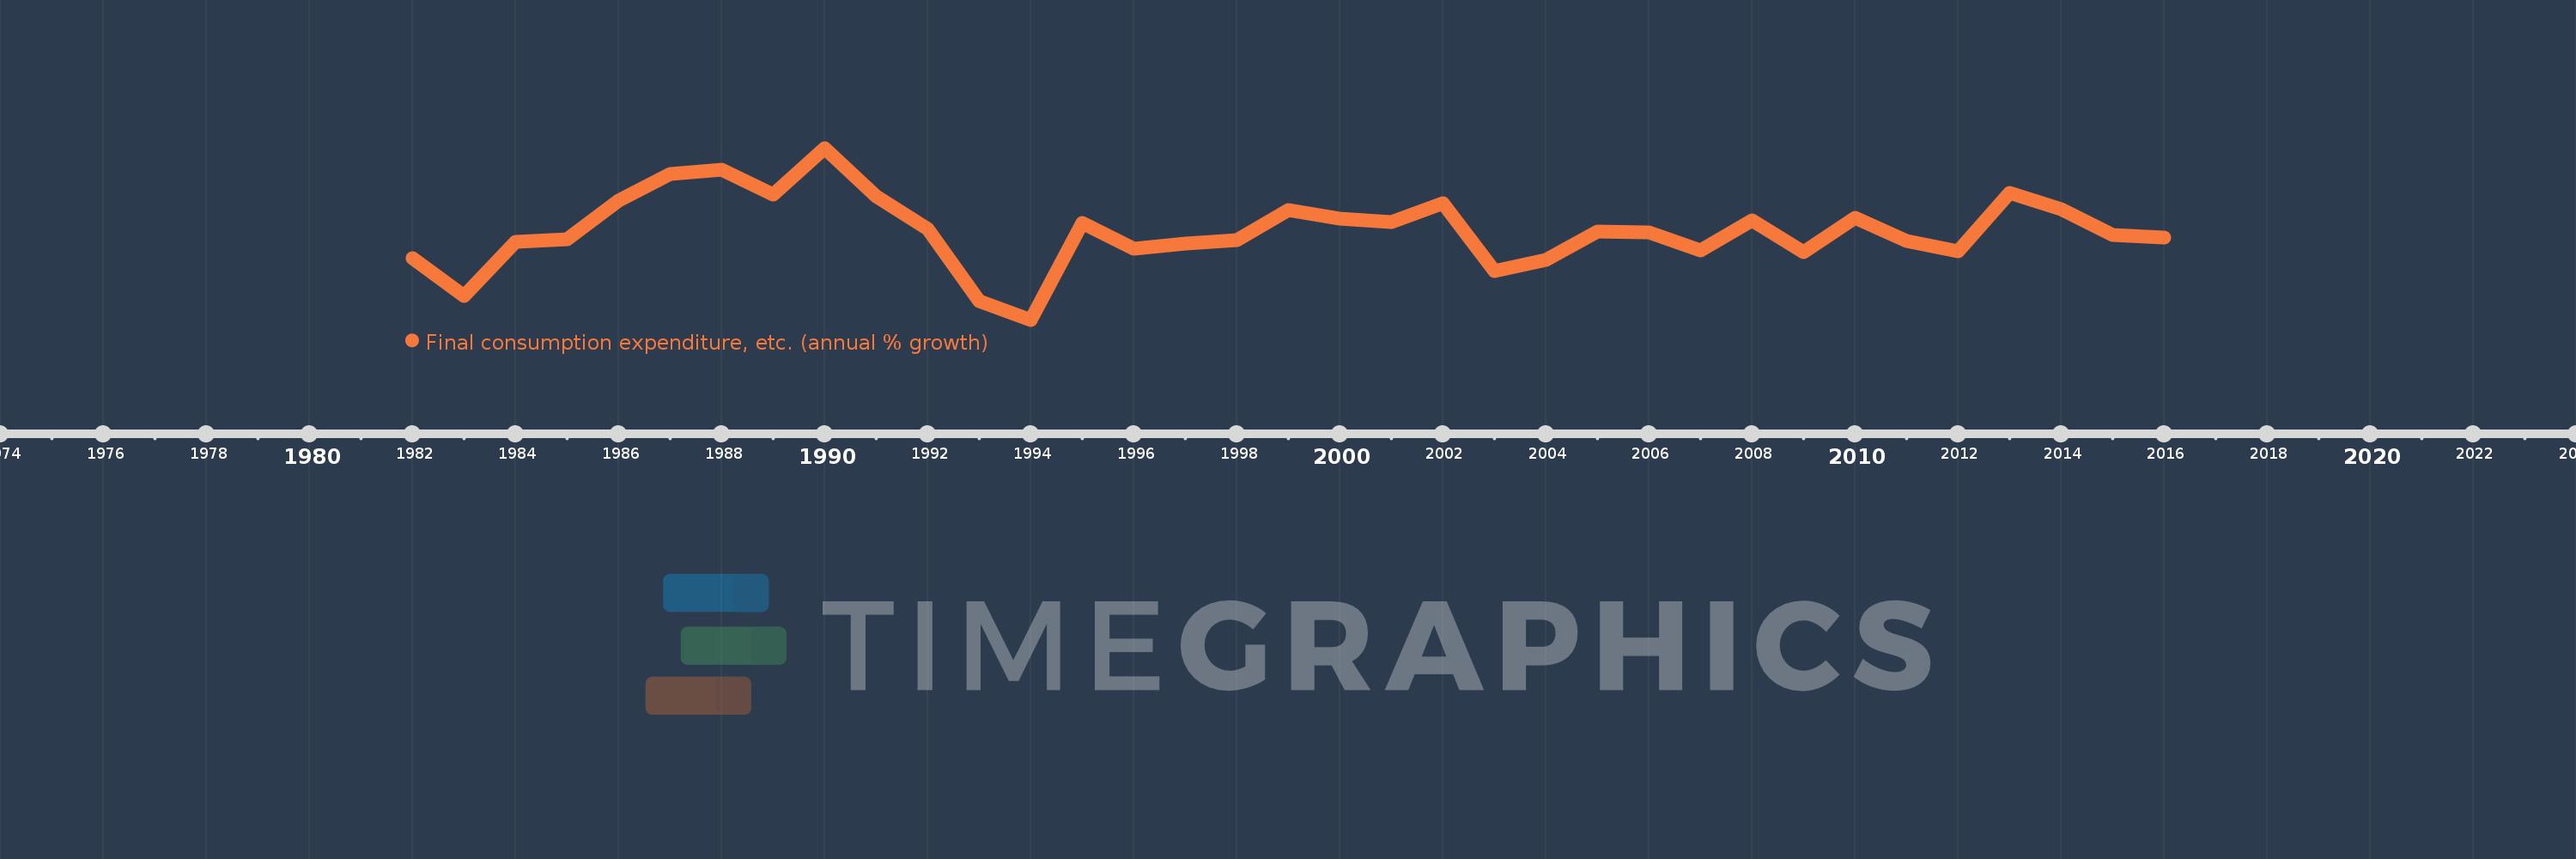
Final consumption expenditure, etc. (annual % growth)
2016,2015,2014,2013,2012,2011,2010,2009,2008,2007,2006,2005,2004,2003,2002,2001,2000,1999,1998,1997,1996,1995,1994,1993,1992,1991,1990,1989,1988,1987,1986,1985,1984,1983,1982
This statistics in other country:
AlbaniaAlgeriaAntigua and BarbudaArab WorldArgentinaArmeniaAustraliaAustriaAzerbaijanBahamas, TheBahrainBangladeshBarbadosBelarusBelgiumBelizeBeninBhutanBoliviaBosnia and HerzegovinaBotswanaBrazilBrunei DarussalamBulgariaBurkina FasoBurundiCabo VerdeCambodiaCameroonCanadaCaribbean small statesCentral Europe and the BalticsChadChileColombiaComorosCongo, Dem. Rep.Congo, Rep.Costa RicaCote d'IvoireCroatiaCubaCyprusCzech RepublicDenmarkDjiboutiDominican RepublicEarly-demographic dividendEast Asia & PacificEcuadorEgypt, Arab Rep.El SalvadorEquatorial GuineaEritreaEstoniaEthiopiaEuro areaEurope & Central AsiaEurope & Central Asia (excluding high income)Europe & Central Asia (IDA & IBRD countries)European UnionFijiFinlandFranceGabonGambia, TheGeorgiaGermanyGhanaGreeceGuatemalaGuineaGuinea-BissauHaitiHeavily indebted poor countries (HIPC)High incomeHondurasHong Kong SAR, ChinaHungaryIBRD onlyIcelandIDA & IBRD totalIDA blendIDA onlyIDA totalIndiaIndonesiaIran, Islamic Rep.IrelandIsraelItalyJamaicaJapanJordanKazakhstanKenyaKorea, Rep.KosovoKuwaitKyrgyz RepublicLao PDRLatin America & Caribbean Latin America & Caribbean (excluding high income)Latin America & the Caribbean (IDA & IBRD countries)LatviaLeast developed countries: UN classificationLebanonLiberiaLithuaniaLow & middle incomeLow incomeLower middle incomeLuxembourgMacao SAR, ChinaMacedonia, FYRMadagascarMalawiMalaysiaMaliMaltaMauritaniaMauritiusMexicoMiddle East & North AfricaMiddle East & North Africa (excluding high income)Middle East & North Africa (IDA & IBRD countries)Middle incomeMoldovaMongoliaMontenegroMoroccoMozambiqueNamibiaNepalNetherlandsNew ZealandNicaraguaNigerNigeriaNorth AmericaNorwayOECD membersOmanOther small statesPakistanPanamaPapua New GuineaParaguayPeruPhilippinesPolandPortugalPost-demographic dividendPre-demographic dividendPuerto RicoQatarRomaniaRussian FederationRwandaSaudi ArabiaSenegalSerbiaSeychellesSierra LeoneSingaporeSlovak RepublicSloveniaSmall statesSomaliaSouth AfricaSouth AsiaSouth Asia (IDA & IBRD)South SudanSpainSri LankaSub-Saharan Africa Sub-Saharan Africa (excluding high income)Sub-Saharan Africa (IDA & IBRD countries)SudanSurinameSwazilandSwedenSwitzerlandSyrian Arab RepublicTajikistanTanzaniaThailandTimor-LesteTogoTrinidad and TobagoTunisiaTurkeyTurkmenistanUgandaUkraineUnited Arab EmiratesUnited KingdomUnited StatesUpper middle incomeUruguayUzbekistanVanuatuVenezuela, RBVietnamWest Bank and GazaWorldZimbabwe Timeline:
This timeline shows a graph from 1982 to 2016 of Switzerland. No data until 1981. Number of actual observations by date: 35.
Source name:
World Development Indicators
Source organization:
World Bank national accounts data, and OECD National Accounts data files.
Categories, topics:
Economy & Growth
Last updated:
apr 23, 2017
Indicators value changes by year
Minimum:
-0.634
jan 1, 1994
At the date of observation
Value
Absolute change
Change from previous value
jan 1, 1982
0.867
+0.867
0.0%
jan 1, 1983
-0.063
-0.93
-107.32%
jan 1, 1984
1.268
+1.331
-2.1K%
jan 1, 1985
1.33
+0.062
4.88%
jan 1, 1986
2.266
+0.937
70.47%
jan 1, 1987
2.898
+0.631
27.86%
jan 1, 1988
3.018
+0.12
4.16%
jan 1, 1989
2.411
-0.607
-20.12%
jan 1, 1990
3.539
+1.128
46.8%
jan 1, 1991
2.362
-1.177
-33.26%
jan 1, 1992
1.579
-0.783
-33.15%
jan 1, 1993
-0.191
-1.77
-112.11%
jan 1, 1994
-0.634
-0.443
231.56%
jan 1, 1995
1.718
+2.352
-371.04%
jan 1, 1996
1.083
-0.636
-36.99%
jan 1, 1997
1.213
+0.13
12.04%
jan 1, 1998
1.309
+0.096
7.93%
jan 1, 1999
2.035
+0.726
55.46%
jan 1, 2000
1.822
-0.213
-10.49%
jan 1, 2001
1.73
-0.092
-5.06%
jan 1, 2002
2.194
+0.464
26.84%
jan 1, 2003
0.547
-1.648
-75.09%
jan 1, 2004
0.818
+0.271
49.58%
jan 1, 2005
1.513
+0.695
85.05%
jan 1, 2006
1.485
-0.028
-1.87%
jan 1, 2007
1.059
-0.426
-28.69%
jan 1, 2008
1.788
+0.729
68.84%
jan 1, 2009
1.011
-0.777
-43.46%
jan 1, 2010
1.844
+0.833
82.38%
jan 1, 2011
1.272
-0.572
-31.0%
jan 1, 2012
1.022
-0.25
-19.65%
jan 1, 2013
2.456
+1.434
140.28%
jan 1, 2014
2.045
-0.41
-16.71%
jan 1, 2015
1.425
-0.62
-30.32%
jan 1, 2016
1.373
-0.052
-3.68%
Ranking of countries by current statistics by years


Comments: