29
/
en
AIzaSyAYiBZKx7MnpbEhh9jyipgxe19OcubqV5w
April 1, 2024
266799
Trinidad and Tobago
TTO
true
2
1
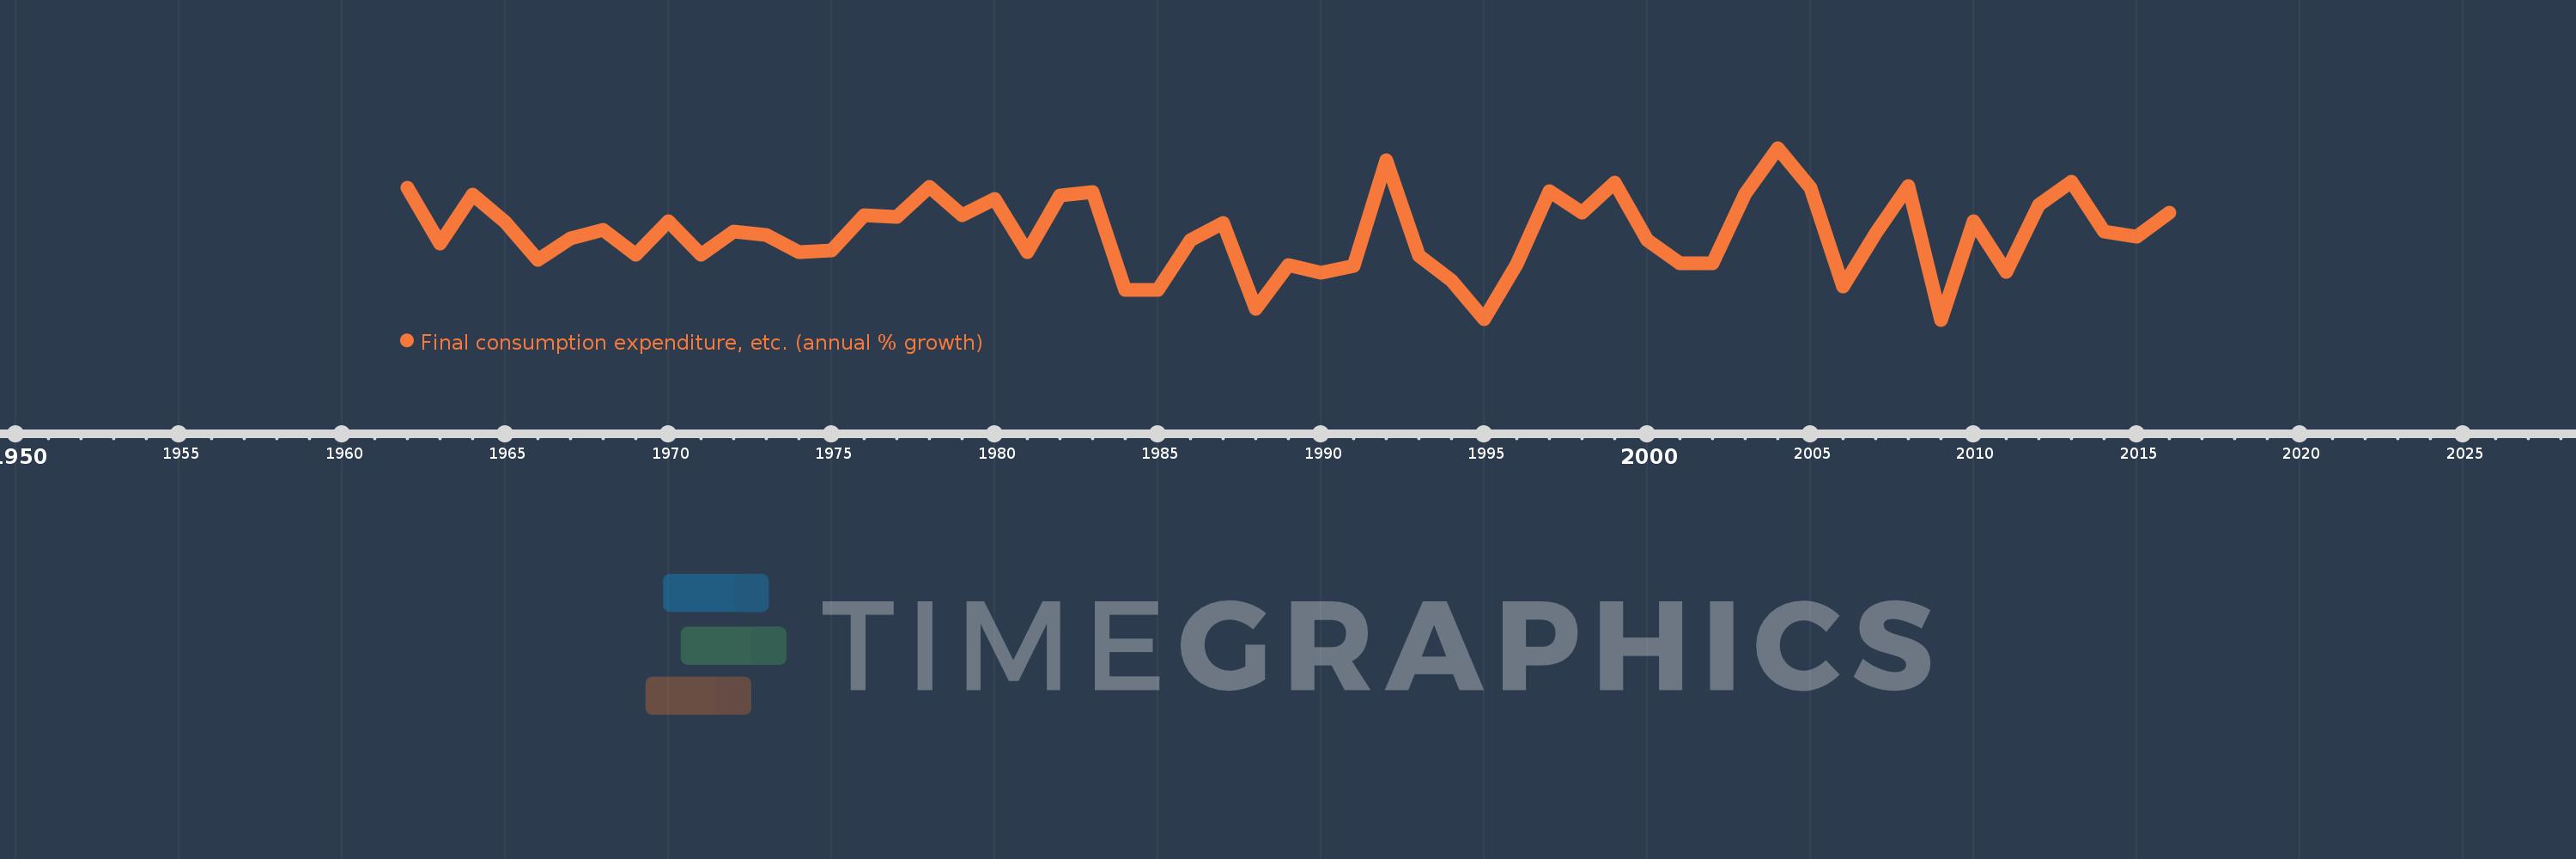
Final consumption expenditure, etc. (annual % growth)
2016,2015,2014,2013,2012,2011,2010,2009,2008,2007,2006,2005,2004,2003,2002,2001,2000,1999,1998,1997,1996,1995,1994,1993,1992,1991,1990,1989,1988,1987,1986,1985,1984,1983,1982,1981,1980,1979,1978,1977,1976,1975,1974,1973,1972,1971,1970,1969,1968,1967,1966,1965,1964,1963,1962
This statistics in other country:
AlbaniaAlgeriaAntigua and BarbudaArab WorldArgentinaArmeniaAustraliaAustriaAzerbaijanBahamas, TheBahrainBangladeshBarbadosBelarusBelgiumBelizeBeninBhutanBoliviaBosnia and HerzegovinaBotswanaBrazilBrunei DarussalamBulgariaBurkina FasoBurundiCabo VerdeCambodiaCameroonCanadaCaribbean small statesCentral Europe and the BalticsChadChileColombiaComorosCongo, Dem. Rep.Congo, Rep.Costa RicaCote d'IvoireCroatiaCubaCyprusCzech RepublicDenmarkDjiboutiDominican RepublicEarly-demographic dividendEast Asia & PacificEcuadorEgypt, Arab Rep.El SalvadorEquatorial GuineaEritreaEstoniaEthiopiaEuro areaEurope & Central AsiaEurope & Central Asia (excluding high income)Europe & Central Asia (IDA & IBRD countries)European UnionFijiFinlandFranceGabonGambia, TheGeorgiaGermanyGhanaGreeceGuatemalaGuineaGuinea-BissauHaitiHeavily indebted poor countries (HIPC)High incomeHondurasHong Kong SAR, ChinaHungaryIBRD onlyIcelandIDA & IBRD totalIDA blendIDA onlyIDA totalIndiaIndonesiaIran, Islamic Rep.IrelandIsraelItalyJamaicaJapanJordanKazakhstanKenyaKorea, Rep.KosovoKuwaitKyrgyz RepublicLao PDRLatin America & Caribbean Latin America & Caribbean (excluding high income)Latin America & the Caribbean (IDA & IBRD countries)LatviaLeast developed countries: UN classificationLebanonLiberiaLithuaniaLow & middle incomeLow incomeLower middle incomeLuxembourgMacao SAR, ChinaMacedonia, FYRMadagascarMalawiMalaysiaMaliMaltaMauritaniaMauritiusMexicoMiddle East & North AfricaMiddle East & North Africa (excluding high income)Middle East & North Africa (IDA & IBRD countries)Middle incomeMoldovaMongoliaMontenegroMoroccoMozambiqueNamibiaNepalNetherlandsNew ZealandNicaraguaNigerNigeriaNorth AmericaNorwayOECD membersOmanOther small statesPakistanPanamaPapua New GuineaParaguayPeruPhilippinesPolandPortugalPost-demographic dividendPre-demographic dividendPuerto RicoQatarRomaniaRussian FederationRwandaSaudi ArabiaSenegalSerbiaSeychellesSierra LeoneSingaporeSlovak RepublicSloveniaSmall statesSomaliaSouth AfricaSouth AsiaSouth Asia (IDA & IBRD)South SudanSpainSri LankaSub-Saharan Africa Sub-Saharan Africa (excluding high income)Sub-Saharan Africa (IDA & IBRD countries)SudanSurinameSwazilandSwedenSwitzerlandSyrian Arab RepublicTajikistanTanzaniaThailandTimor-LesteTogoTrinidad and TobagoTunisiaTurkeyTurkmenistanUgandaUkraineUnited Arab EmiratesUnited KingdomUnited StatesUpper middle incomeUruguayUzbekistanVanuatuVenezuela, RBVietnamWest Bank and GazaWorldZimbabwe Timeline:
This timeline shows a graph from 1962 to 2016 of Trinidad and Tobago. No data until 1961. Number of actual observations by date: 55.
Source name:
World Development Indicators
Source organization:
World Bank national accounts data, and OECD National Accounts data files.
Categories, topics:
Economy & Growth
Last updated:
apr 23, 2017
Indicators value changes by year
Minimum:
-17.055
jan 1, 2009
Maximum:
24.943
jan 1, 2004
At the date of observation
Value
Absolute change
Change from previous value
jan 1, 1962
15.189
+15.189
0.0%
jan 1, 1963
1.566
-13.623
-89.69%
jan 1, 1964
13.5
+11.933
761.79%
jan 1, 1965
6.798
-6.702
-49.64%
jan 1, 1966
-2.511
-9.309
-136.94%
jan 1, 1967
2.737
+5.248
-208.99%
jan 1, 1968
4.905
+2.168
79.19%
jan 1, 1969
-1.064
-5.969
-121.7%
jan 1, 1970
7.127
+8.191
-769.59%
jan 1, 1971
-1.25
-8.376
-117.53%
jan 1, 1972
4.406
+5.656
-452.62%
jan 1, 1973
3.723
-0.683
-15.51%
jan 1, 1974
-0.579
-4.301
-115.54%
jan 1, 1975
-0.113
+0.466
-80.55%
jan 1, 1976
8.527
+8.639
-7.67K%
jan 1, 1977
8.003
-0.523
-6.14%
jan 1, 1978
15.442
+7.439
92.95%
jan 1, 1979
8.544
-6.898
-44.67%
jan 1, 1980
12.519
+3.976
46.53%
jan 1, 1981
-0.598
-13.117
-104.78%
jan 1, 1982
13.321
+13.919
-2.33K%
jan 1, 1983
14.191
+0.87
6.53%
jan 1, 1984
-9.683
-23.874
-168.24%
jan 1, 1985
-9.725
-0.042
0.43%
jan 1, 1986
2.511
+12.235
-125.82%
jan 1, 1987
6.65
+4.139
164.86%
jan 1, 1988
-14.305
-20.955
-315.12%
jan 1, 1989
-3.779
+10.526
-73.58%
jan 1, 1990
-5.557
-1.778
47.05%
jan 1, 1991
-3.866
+1.691
-30.44%
jan 1, 1992
22.02
+25.885
-669.63%
jan 1, 1993
-1.373
-23.392
-106.23%
jan 1, 1994
-7.372
-6.0
437.03%
jan 1, 1995
-16.872
-9.499
128.85%
jan 1, 1996
-3.548
+13.323
-78.97%
jan 1, 1997
14.464
+18.012
-507.64%
jan 1, 1998
9.097
-5.367
-37.1%
jan 1, 1999
16.446
+7.349
80.78%
jan 1, 2000
2.373
-14.073
-85.57%
jan 1, 2001
-3.28
-5.654
-238.23%
jan 1, 2002
-3.317
-0.037
1.13%
jan 1, 2003
13.79
+17.108
-515.7%
jan 1, 2004
24.943
+11.153
80.87%
jan 1, 2005
15.197
-9.746
-39.07%
jan 1, 2006
-8.863
-24.059
-158.32%
jan 1, 2007
4.142
+13.005
-146.74%
jan 1, 2008
15.724
+11.582
279.6%
jan 1, 2009
-17.055
-32.779
-208.47%
jan 1, 2010
7.081
+24.136
-141.52%
jan 1, 2011
-5.459
-12.539
-177.1%
jan 1, 2012
11.033
+16.492
-302.11%
jan 1, 2013
16.614
+5.581
50.59%
jan 1, 2014
4.471
-12.143
-73.09%
jan 1, 2015
3.231
-1.24
-27.74%
jan 1, 2016
9.081
+5.85
181.04%
Ranking of countries by current statistics by years


Comments: