29
/
en
AIzaSyAYiBZKx7MnpbEhh9jyipgxe19OcubqV5w
April 1, 2024
235728
Senegal
SEN
true
2
1
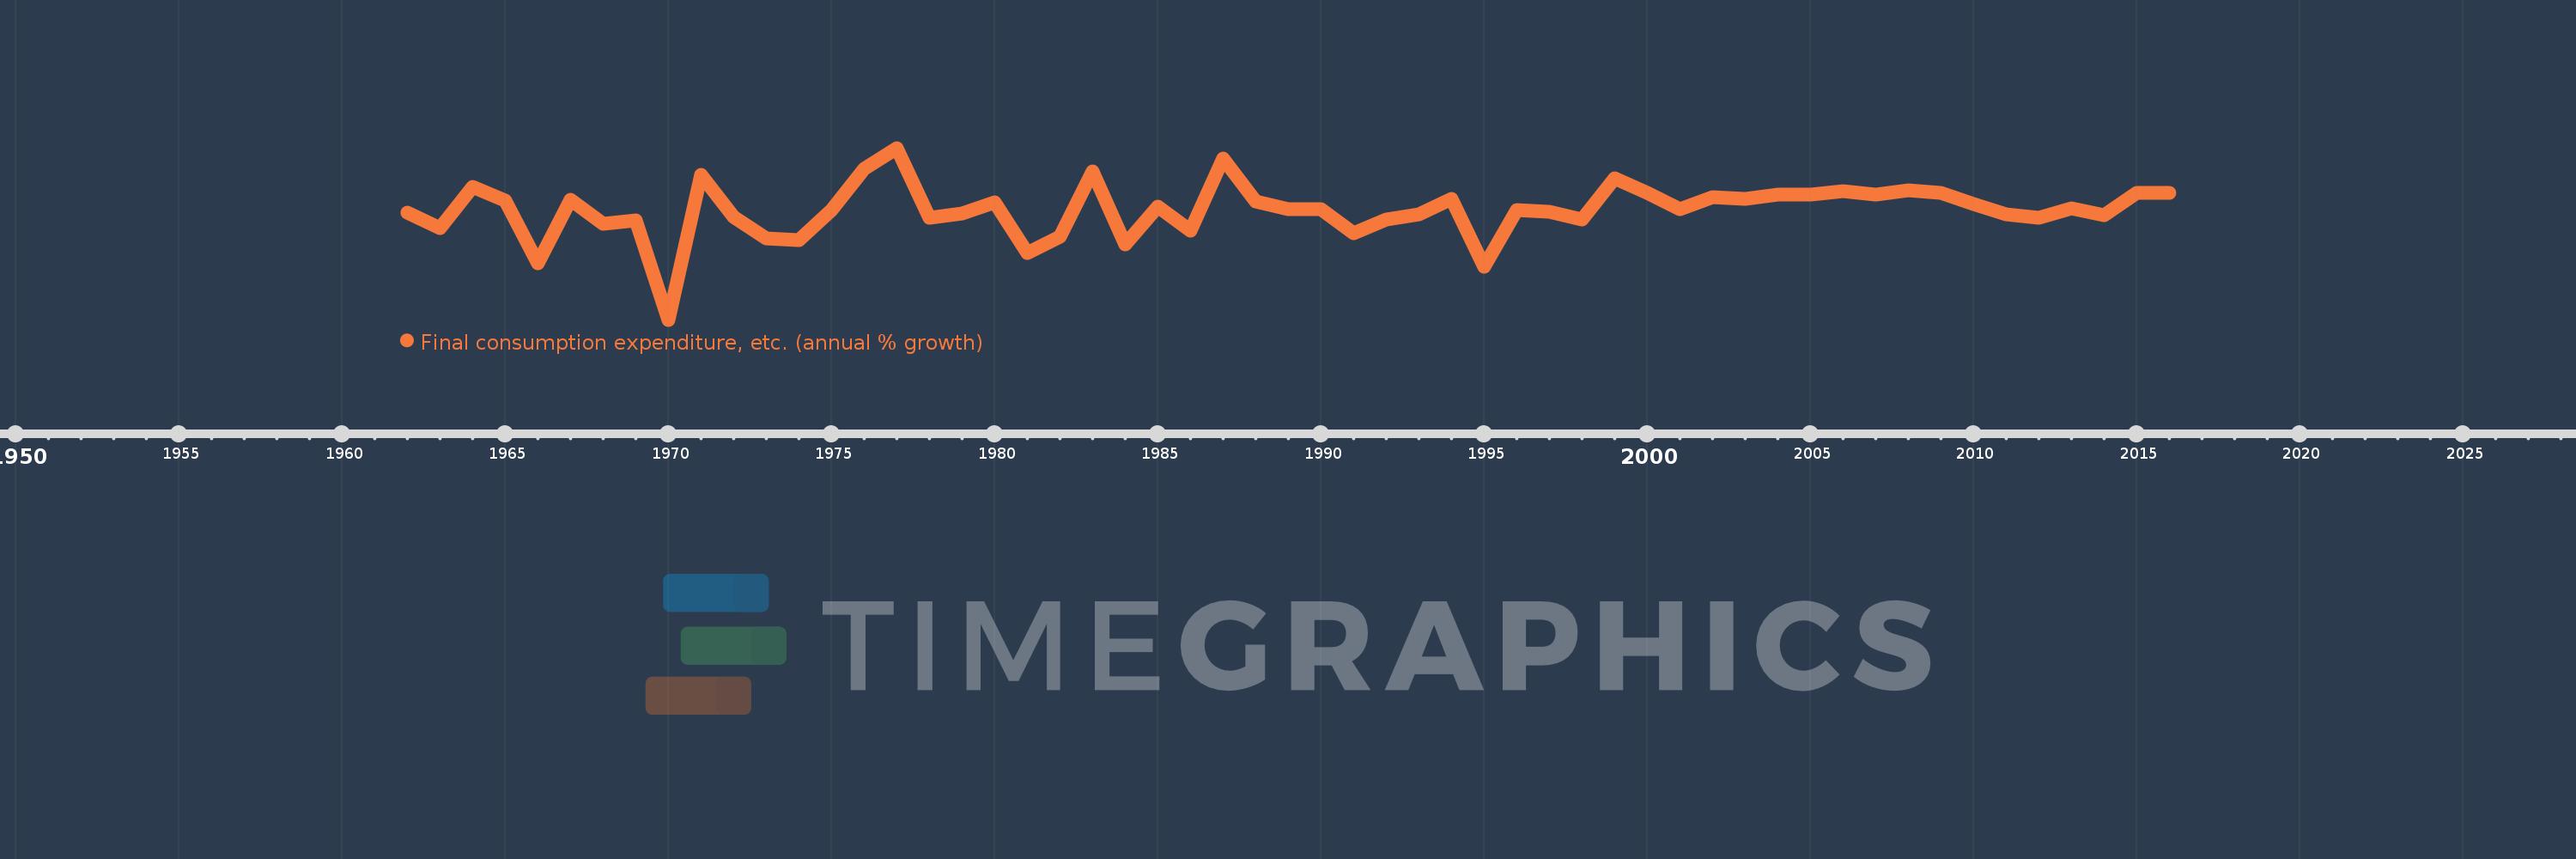
Final consumption expenditure, etc. (annual % growth)
2016,2015,2014,2013,2012,2011,2010,2009,2008,2007,2006,2005,2004,2003,2002,2001,2000,1999,1998,1997,1996,1995,1994,1993,1992,1991,1990,1989,1988,1987,1986,1985,1984,1983,1982,1981,1980,1979,1978,1977,1976,1975,1974,1973,1972,1971,1970,1969,1968,1967,1966,1965,1964,1963,1962
This statistics in other country:
AlbaniaAlgeriaAntigua and BarbudaArab WorldArgentinaArmeniaAustraliaAustriaAzerbaijanBahamas, TheBahrainBangladeshBarbadosBelarusBelgiumBelizeBeninBhutanBoliviaBosnia and HerzegovinaBotswanaBrazilBrunei DarussalamBulgariaBurkina FasoBurundiCabo VerdeCambodiaCameroonCanadaCaribbean small statesCentral Europe and the BalticsChadChileColombiaComorosCongo, Dem. Rep.Congo, Rep.Costa RicaCote d'IvoireCroatiaCubaCyprusCzech RepublicDenmarkDjiboutiDominican RepublicEarly-demographic dividendEast Asia & PacificEcuadorEgypt, Arab Rep.El SalvadorEquatorial GuineaEritreaEstoniaEthiopiaEuro areaEurope & Central AsiaEurope & Central Asia (excluding high income)Europe & Central Asia (IDA & IBRD countries)European UnionFijiFinlandFranceGabonGambia, TheGeorgiaGermanyGhanaGreeceGuatemalaGuineaGuinea-BissauHaitiHeavily indebted poor countries (HIPC)High incomeHondurasHong Kong SAR, ChinaHungaryIBRD onlyIcelandIDA & IBRD totalIDA blendIDA onlyIDA totalIndiaIndonesiaIran, Islamic Rep.IrelandIsraelItalyJamaicaJapanJordanKazakhstanKenyaKorea, Rep.KosovoKuwaitKyrgyz RepublicLao PDRLatin America & Caribbean Latin America & Caribbean (excluding high income)Latin America & the Caribbean (IDA & IBRD countries)LatviaLeast developed countries: UN classificationLebanonLiberiaLithuaniaLow & middle incomeLow incomeLower middle incomeLuxembourgMacao SAR, ChinaMacedonia, FYRMadagascarMalawiMalaysiaMaliMaltaMauritaniaMauritiusMexicoMiddle East & North AfricaMiddle East & North Africa (excluding high income)Middle East & North Africa (IDA & IBRD countries)Middle incomeMoldovaMongoliaMontenegroMoroccoMozambiqueNamibiaNepalNetherlandsNew ZealandNicaraguaNigerNigeriaNorth AmericaNorwayOECD membersOmanOther small statesPakistanPanamaPapua New GuineaParaguayPeruPhilippinesPolandPortugalPost-demographic dividendPre-demographic dividendPuerto RicoQatarRomaniaRussian FederationRwandaSaudi ArabiaSenegalSerbiaSeychellesSierra LeoneSingaporeSlovak RepublicSloveniaSmall statesSomaliaSouth AfricaSouth AsiaSouth Asia (IDA & IBRD)South SudanSpainSri LankaSub-Saharan Africa Sub-Saharan Africa (excluding high income)Sub-Saharan Africa (IDA & IBRD countries)SudanSurinameSwazilandSwedenSwitzerlandSyrian Arab RepublicTajikistanTanzaniaThailandTimor-LesteTogoTrinidad and TobagoTunisiaTurkeyTurkmenistanUgandaUkraineUnited Arab EmiratesUnited KingdomUnited StatesUpper middle incomeUruguayUzbekistanVanuatuVenezuela, RBVietnamWest Bank and GazaWorldZimbabwe Timeline:
This timeline shows a graph from 1962 to 2016 of Senegal. No data until 1961. Number of actual observations by date: 55.
Source name:
World Development Indicators
Source organization:
World Bank national accounts data, and OECD National Accounts data files.
Categories, topics:
Economy & Growth
Last updated:
apr 23, 2017
Indicators value changes by year
Minimum:
-10.916
jan 1, 1970
Maximum:
10.551
jan 1, 1977
At the date of observation
Value
Absolute change
Change from previous value
jan 1, 1962
2.47
+2.47
0.0%
jan 1, 1963
0.534
-1.936
-78.39%
jan 1, 1964
5.67
+5.136
962.04%
jan 1, 1965
3.953
-1.717
-30.29%
jan 1, 1966
-3.915
-7.868
-199.03%
jan 1, 1967
4.115
+8.03
-205.13%
jan 1, 1968
1.033
-3.082
-74.89%
jan 1, 1969
1.495
+0.461
44.63%
jan 1, 1970
-10.916
-12.411
-830.33%
jan 1, 1971
7.223
+18.139
-166.16%
jan 1, 1972
1.921
-5.301
-73.4%
jan 1, 1973
-0.741
-2.662
-138.56%
jan 1, 1974
-0.929
-0.188
25.32%
jan 1, 1975
2.833
+3.761
-405.06%
jan 1, 1976
7.974
+5.142
181.52%
jan 1, 1977
10.551
+2.576
32.31%
jan 1, 1978
1.78
-8.771
-83.13%
jan 1, 1979
2.379
+0.599
33.64%
jan 1, 1980
3.758
+1.379
57.98%
jan 1, 1981
-2.594
-6.352
-169.01%
jan 1, 1982
-0.542
+2.052
-79.11%
jan 1, 1983
7.592
+8.134
-1.5K%
jan 1, 1984
-1.532
-9.125
-120.18%
jan 1, 1985
3.189
+4.721
-308.07%
jan 1, 1986
0.222
-2.966
-93.03%
jan 1, 1987
9.284
+9.061
4.08K%
jan 1, 1988
3.84
-5.444
-58.64%
jan 1, 1989
2.948
-0.892
-23.23%
jan 1, 1990
2.893
-0.054
-1.84%
jan 1, 1991
-0.125
-3.019
-104.33%
jan 1, 1992
1.594
+1.719
-1.37K%
jan 1, 1993
2.245
+0.651
40.85%
jan 1, 1994
4.148
+1.903
84.76%
jan 1, 1995
-4.326
-8.474
-204.28%
jan 1, 1996
2.772
+7.098
-164.09%
jan 1, 1997
2.568
-0.204
-7.36%
jan 1, 1998
1.57
-0.998
-38.86%
jan 1, 1999
6.724
+5.154
328.19%
jan 1, 2000
4.891
-1.833
-27.26%
jan 1, 2001
2.858
-2.034
-41.58%
jan 1, 2002
4.452
+1.594
55.78%
jan 1, 2003
4.219
-0.232
-5.22%
jan 1, 2004
4.702
+0.483
11.44%
jan 1, 2005
4.755
+0.053
1.13%
jan 1, 2006
5.119
+0.364
7.65%
jan 1, 2007
4.723
-0.396
-7.73%
jan 1, 2008
5.27
+0.547
11.58%
jan 1, 2009
4.938
-0.331
-6.29%
jan 1, 2010
3.56
-1.379
-27.92%
jan 1, 2011
2.202
-1.358
-38.15%
jan 1, 2012
1.865
-0.337
-15.29%
jan 1, 2013
3.047
+1.182
63.38%
jan 1, 2014
2.199
-0.848
-27.83%
jan 1, 2015
4.984
+2.785
126.62%
jan 1, 2016
4.946
-0.038
-0.77%
Ranking of countries by current statistics by years


Comments: