29
/
en
AIzaSyAYiBZKx7MnpbEhh9jyipgxe19OcubqV5w
April 1, 2024
214276
Norway
NOR
true
2
1
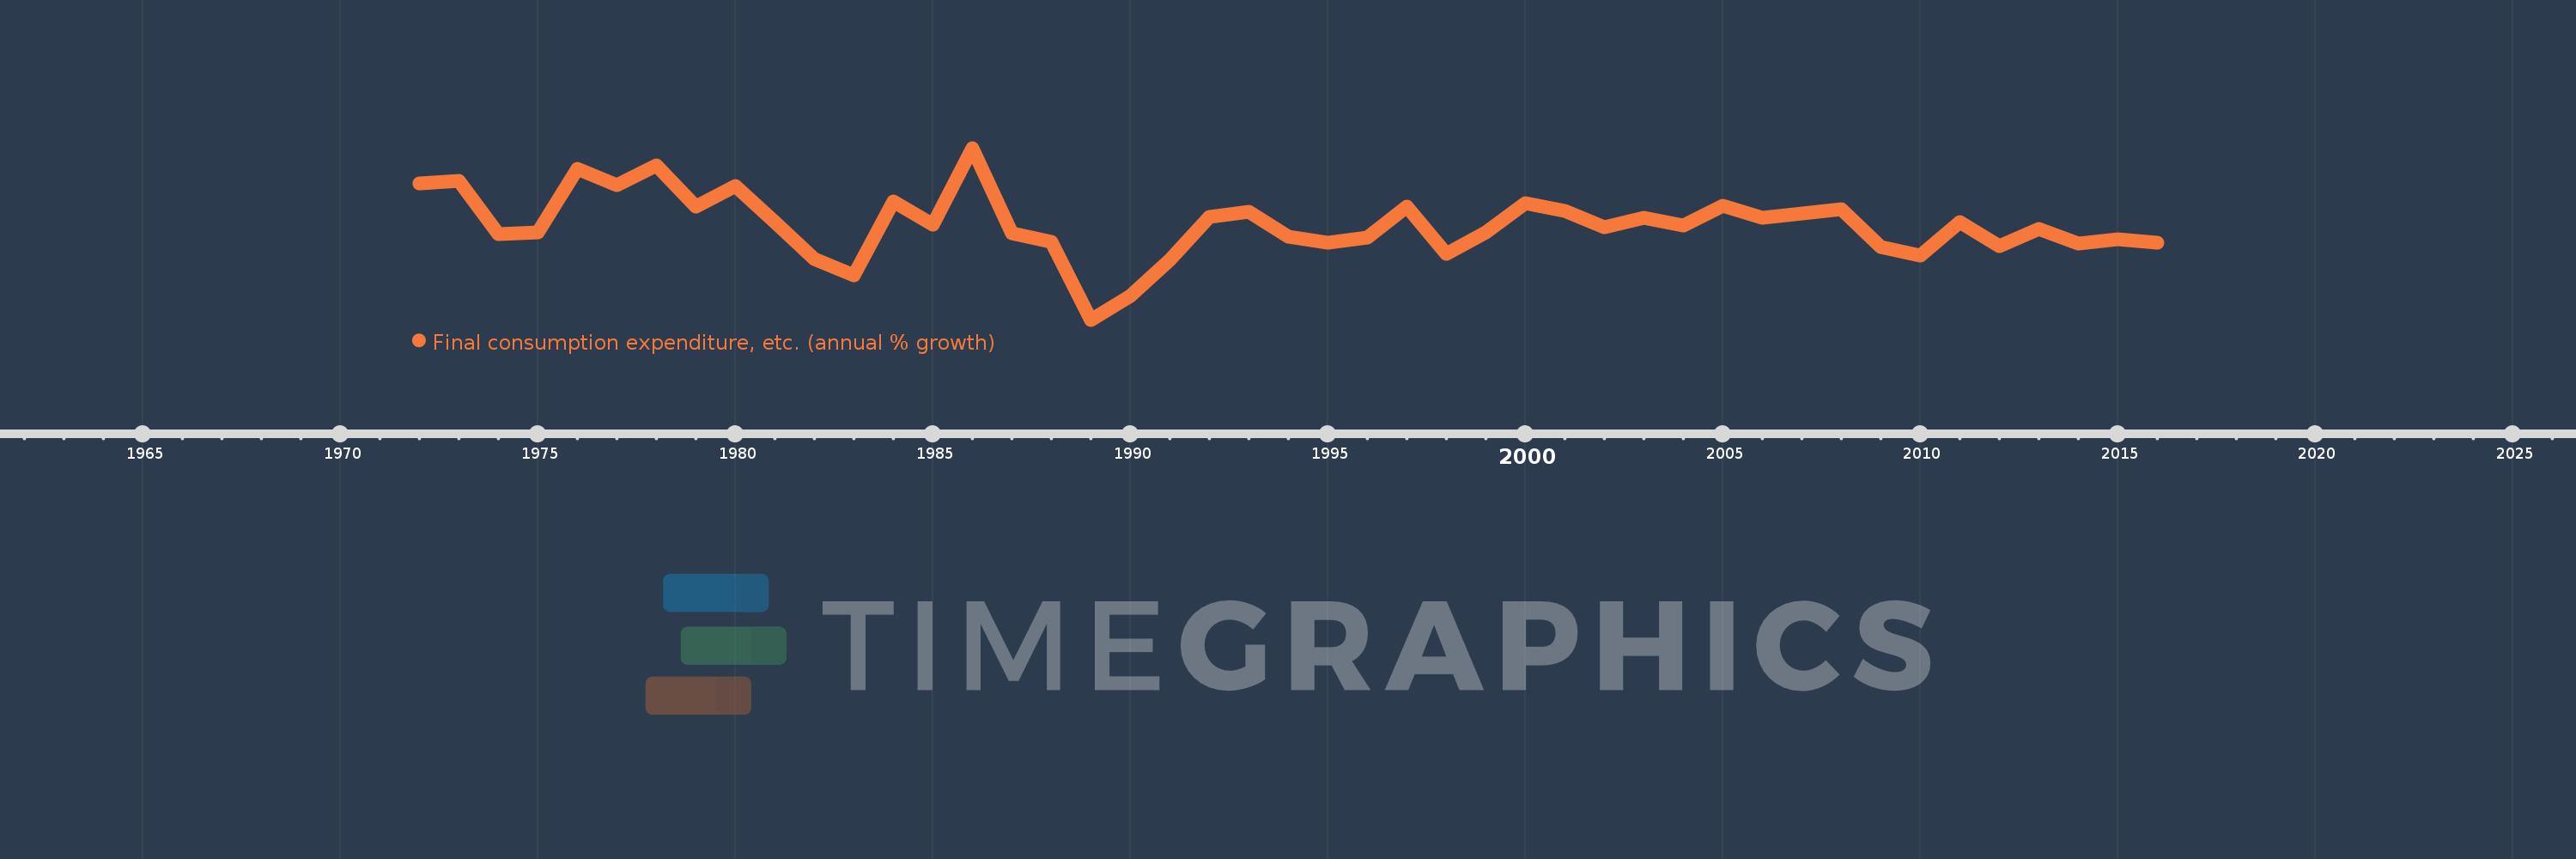
Final consumption expenditure, etc. (annual % growth)
2016,2015,2014,2013,2012,2011,2010,2009,2008,2007,2006,2005,2004,2003,2002,2001,2000,1999,1998,1997,1996,1995,1994,1993,1992,1991,1990,1989,1988,1987,1986,1985,1984,1983,1982,1981,1980,1979,1978,1977,1976,1975,1974,1973,1972
This statistics in other country:
AlbaniaAlgeriaAntigua and BarbudaArab WorldArgentinaArmeniaAustraliaAustriaAzerbaijanBahamas, TheBahrainBangladeshBarbadosBelarusBelgiumBelizeBeninBhutanBoliviaBosnia and HerzegovinaBotswanaBrazilBrunei DarussalamBulgariaBurkina FasoBurundiCabo VerdeCambodiaCameroonCanadaCaribbean small statesCentral Europe and the BalticsChadChileColombiaComorosCongo, Dem. Rep.Congo, Rep.Costa RicaCote d'IvoireCroatiaCubaCyprusCzech RepublicDenmarkDjiboutiDominican RepublicEarly-demographic dividendEast Asia & PacificEcuadorEgypt, Arab Rep.El SalvadorEquatorial GuineaEritreaEstoniaEthiopiaEuro areaEurope & Central AsiaEurope & Central Asia (excluding high income)Europe & Central Asia (IDA & IBRD countries)European UnionFijiFinlandFranceGabonGambia, TheGeorgiaGermanyGhanaGreeceGuatemalaGuineaGuinea-BissauHaitiHeavily indebted poor countries (HIPC)High incomeHondurasHong Kong SAR, ChinaHungaryIBRD onlyIcelandIDA & IBRD totalIDA blendIDA onlyIDA totalIndiaIndonesiaIran, Islamic Rep.IrelandIsraelItalyJamaicaJapanJordanKazakhstanKenyaKorea, Rep.KosovoKuwaitKyrgyz RepublicLao PDRLatin America & Caribbean Latin America & Caribbean (excluding high income)Latin America & the Caribbean (IDA & IBRD countries)LatviaLeast developed countries: UN classificationLebanonLiberiaLithuaniaLow & middle incomeLow incomeLower middle incomeLuxembourgMacao SAR, ChinaMacedonia, FYRMadagascarMalawiMalaysiaMaliMaltaMauritaniaMauritiusMexicoMiddle East & North AfricaMiddle East & North Africa (excluding high income)Middle East & North Africa (IDA & IBRD countries)Middle incomeMoldovaMongoliaMontenegroMoroccoMozambiqueNamibiaNepalNetherlandsNew ZealandNicaraguaNigerNigeriaNorth AmericaNorwayOECD membersOmanOther small statesPakistanPanamaPapua New GuineaParaguayPeruPhilippinesPolandPortugalPost-demographic dividendPre-demographic dividendPuerto RicoQatarRomaniaRussian FederationRwandaSaudi ArabiaSenegalSerbiaSeychellesSierra LeoneSingaporeSlovak RepublicSloveniaSmall statesSomaliaSouth AfricaSouth AsiaSouth Asia (IDA & IBRD)South SudanSpainSri LankaSub-Saharan Africa Sub-Saharan Africa (excluding high income)Sub-Saharan Africa (IDA & IBRD countries)SudanSurinameSwazilandSwedenSwitzerlandSyrian Arab RepublicTajikistanTanzaniaThailandTimor-LesteTogoTrinidad and TobagoTunisiaTurkeyTurkmenistanUgandaUkraineUnited Arab EmiratesUnited KingdomUnited StatesUpper middle incomeUruguayUzbekistanVanuatuVenezuela, RBVietnamWest Bank and GazaWorldZimbabwe Timeline:
This timeline shows a graph from 1972 to 2016 of Norway. No data until 1971. Number of actual observations by date: 45.
Source name:
World Development Indicators
Source organization:
World Bank national accounts data, and OECD National Accounts data files.
Categories, topics:
Economy & Growth
Last updated:
apr 23, 2017
Indicators value changes by year
Minimum:
-1.906
jan 1, 1989
At the date of observation
Value
Absolute change
Change from previous value
jan 1, 1972
5.134
+5.134
0.0%
jan 1, 1973
5.27
+0.136
2.65%
jan 1, 1974
2.528
-2.742
-52.03%
jan 1, 1975
2.611
+0.083
3.26%
jan 1, 1976
5.886
+3.275
125.45%
jan 1, 1977
5.042
-0.844
-14.33%
jan 1, 1978
6.036
+0.993
19.7%
jan 1, 1979
3.932
-2.104
-34.85%
jan 1, 1980
4.974
+1.042
26.49%
jan 1, 1981
3.116
-1.858
-37.36%
jan 1, 1982
1.229
-1.887
-60.56%
jan 1, 1983
0.391
-0.838
-68.2%
jan 1, 1984
4.183
+3.792
970.18%
jan 1, 1985
2.988
-1.194
-28.55%
jan 1, 1986
6.947
+3.959
132.47%
jan 1, 1987
2.537
-4.41
-63.48%
jan 1, 1988
2.098
-0.44
-17.33%
jan 1, 1989
-1.906
-4.004
-190.89%
jan 1, 1990
-0.692
+1.215
-63.71%
jan 1, 1991
1.18
+1.872
-270.65%
jan 1, 1992
3.387
+2.206
186.91%
jan 1, 1993
3.636
+0.249
7.34%
jan 1, 1994
2.37
-1.266
-34.81%
jan 1, 1995
2.044
-0.326
-13.76%
jan 1, 1996
2.326
+0.282
13.81%
jan 1, 1997
3.919
+1.592
68.46%
jan 1, 1998
1.494
-2.425
-61.89%
jan 1, 1999
2.575
+1.082
72.43%
jan 1, 2000
4.122
+1.547
60.07%
jan 1, 2001
3.722
-0.401
-9.72%
jan 1, 2002
2.882
-0.84
-22.57%
jan 1, 2003
3.365
+0.483
16.77%
jan 1, 2004
2.928
-0.437
-12.98%
jan 1, 2005
3.98
+1.052
35.92%
jan 1, 2006
3.351
-0.629
-15.81%
jan 1, 2007
3.548
+0.197
5.89%
jan 1, 2008
3.773
+0.225
6.35%
jan 1, 2009
1.823
-1.95
-51.67%
jan 1, 2010
1.416
-0.408
-22.36%
jan 1, 2011
3.139
+1.723
121.71%
jan 1, 2012
1.882
-1.257
-40.06%
jan 1, 2013
2.756
+0.875
46.48%
jan 1, 2014
2.038
-0.718
-26.06%
jan 1, 2015
2.231
+0.193
9.48%
jan 1, 2016
2.074
-0.157
-7.04%
Ranking of countries by current statistics by years


Comments: