29
/
en
AIzaSyAYiBZKx7MnpbEhh9jyipgxe19OcubqV5w
April 1, 2024
65960
Algeria
DZA
true
2
1
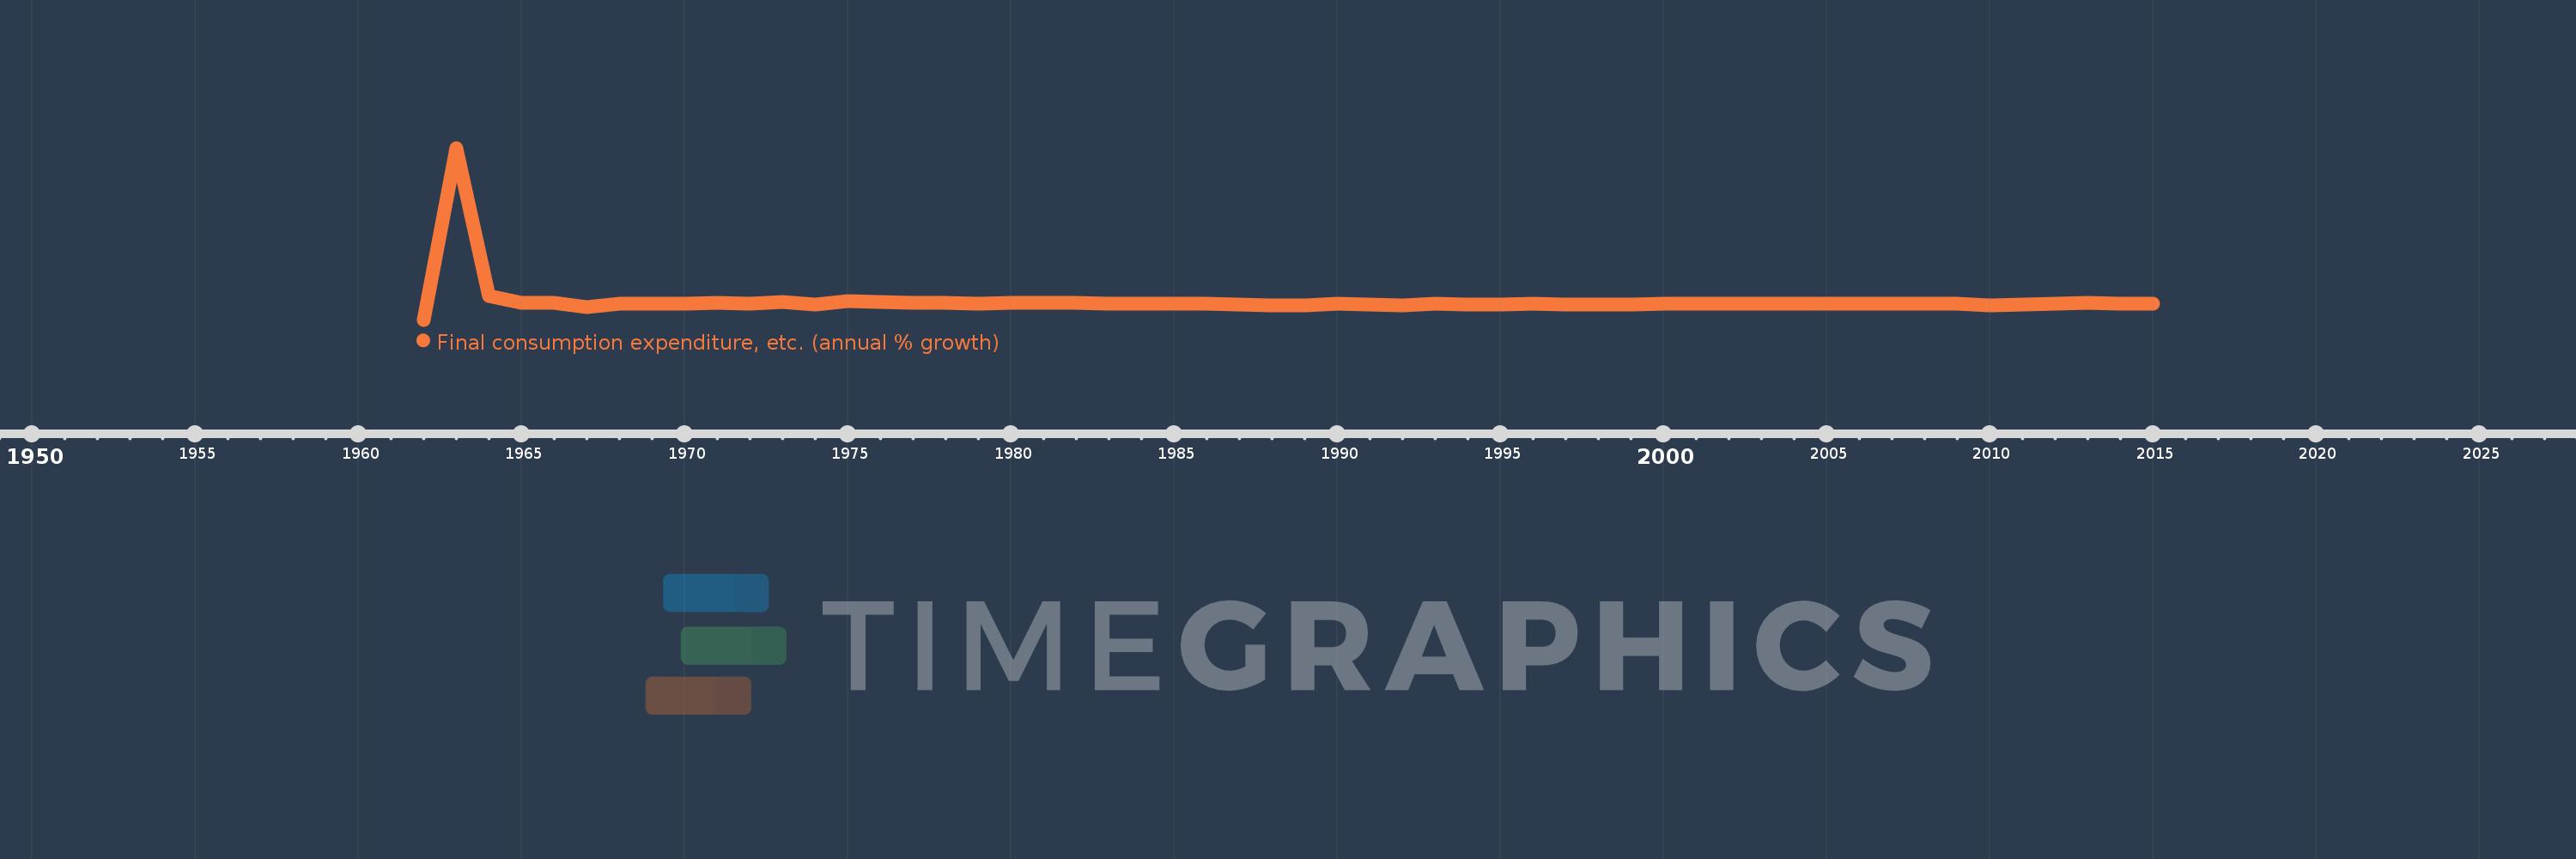
Final consumption expenditure, etc. (annual % growth)
2015,2014,2013,2012,2011,2010,2009,2008,2007,2006,2005,2004,2003,2002,2001,2000,1999,1998,1997,1996,1995,1994,1993,1992,1991,1990,1989,1988,1987,1986,1985,1984,1983,1982,1981,1980,1979,1978,1977,1976,1975,1974,1973,1972,1971,1970,1969,1968,1967,1966,1965,1964,1963,1962
This statistics in other country:
AlbaniaAlgeriaAntigua and BarbudaArab WorldArgentinaArmeniaAustraliaAustriaAzerbaijanBahamas, TheBahrainBangladeshBarbadosBelarusBelgiumBelizeBeninBhutanBoliviaBosnia and HerzegovinaBotswanaBrazilBrunei DarussalamBulgariaBurkina FasoBurundiCabo VerdeCambodiaCameroonCanadaCaribbean small statesCentral Europe and the BalticsChadChileColombiaComorosCongo, Dem. Rep.Congo, Rep.Costa RicaCote d'IvoireCroatiaCubaCyprusCzech RepublicDenmarkDjiboutiDominican RepublicEarly-demographic dividendEast Asia & PacificEcuadorEgypt, Arab Rep.El SalvadorEquatorial GuineaEritreaEstoniaEthiopiaEuro areaEurope & Central AsiaEurope & Central Asia (excluding high income)Europe & Central Asia (IDA & IBRD countries)European UnionFijiFinlandFranceGabonGambia, TheGeorgiaGermanyGhanaGreeceGuatemalaGuineaGuinea-BissauHaitiHeavily indebted poor countries (HIPC)High incomeHondurasHong Kong SAR, ChinaHungaryIBRD onlyIcelandIDA & IBRD totalIDA blendIDA onlyIDA totalIndiaIndonesiaIran, Islamic Rep.IrelandIsraelItalyJamaicaJapanJordanKazakhstanKenyaKorea, Rep.KosovoKuwaitKyrgyz RepublicLao PDRLatin America & Caribbean Latin America & Caribbean (excluding high income)Latin America & the Caribbean (IDA & IBRD countries)LatviaLeast developed countries: UN classificationLebanonLiberiaLithuaniaLow & middle incomeLow incomeLower middle incomeLuxembourgMacao SAR, ChinaMacedonia, FYRMadagascarMalawiMalaysiaMaliMaltaMauritaniaMauritiusMexicoMiddle East & North AfricaMiddle East & North Africa (excluding high income)Middle East & North Africa (IDA & IBRD countries)Middle incomeMoldovaMongoliaMontenegroMoroccoMozambiqueNamibiaNepalNetherlandsNew ZealandNicaraguaNigerNigeriaNorth AmericaNorwayOECD membersOmanOther small statesPakistanPanamaPapua New GuineaParaguayPeruPhilippinesPolandPortugalPost-demographic dividendPre-demographic dividendPuerto RicoQatarRomaniaRussian FederationRwandaSaudi ArabiaSenegalSerbiaSeychellesSierra LeoneSingaporeSlovak RepublicSloveniaSmall statesSomaliaSouth AfricaSouth AsiaSouth Asia (IDA & IBRD)South SudanSpainSri LankaSub-Saharan Africa Sub-Saharan Africa (excluding high income)Sub-Saharan Africa (IDA & IBRD countries)SudanSurinameSwazilandSwedenSwitzerlandSyrian Arab RepublicTajikistanTanzaniaThailandTimor-LesteTogoTrinidad and TobagoTunisiaTurkeyTurkmenistanUgandaUkraineUnited Arab EmiratesUnited KingdomUnited StatesUpper middle incomeUruguayUzbekistanVanuatuVenezuela, RBVietnamWest Bank and GazaWorldZimbabwe Timeline:
This timeline shows a graph from 1962 to 2015 of Algeria. No data until 1961. Number of actual observations by date: 54.
Source name:
World Development Indicators
Source organization:
World Bank national accounts data, and OECD National Accounts data files.
Categories, topics:
Economy & Growth
Last updated:
apr 23, 2017
Indicators value changes by year
Minimum:
-87.345
jan 1, 1962
Maximum:
900.126
jan 1, 1963
At the date of observation
Value
Absolute change
Change from previous value
jan 1, 1962
-87.345
-87.345
0.0%
jan 1, 1963
900.126
+987.471
-1.13K%
jan 1, 1964
50.088
-850.038
-94.44%
jan 1, 1965
7.983
-42.105
-84.06%
jan 1, 1966
7.937
-0.046
-0.57%
jan 1, 1967
-14.431
-22.368
-281.81%
jan 1, 1968
2.518
+16.949
-117.45%
jan 1, 1969
6.306
+3.788
150.41%
jan 1, 1970
6.229
-0.076
-1.21%
jan 1, 1971
9.908
+3.679
59.05%
jan 1, 1972
7.041
-2.867
-28.94%
jan 1, 1973
16.325
+9.284
131.86%
jan 1, 1974
0.715
-15.61
-95.62%
jan 1, 1975
20.645
+19.93
2.79K%
jan 1, 1976
14.49
-6.155
-29.81%
jan 1, 1977
7.801
-6.689
-46.16%
jan 1, 1978
10.955
+3.154
40.43%
jan 1, 1979
2.524
-8.43
-76.96%
jan 1, 1980
9.704
+7.179
284.4%
jan 1, 1981
11.816
+2.112
21.77%
jan 1, 1982
8.3
-3.516
-29.76%
jan 1, 1983
2.9
-5.4
-65.06%
jan 1, 1984
6.1
+3.2
110.34%
jan 1, 1985
5.4
-0.7
-11.48%
jan 1, 1986
4.6
-0.8
-14.81%
jan 1, 1987
-2.0
-6.6
-143.48%
jan 1, 1988
-5.6
-3.6
180.0%
jan 1, 1989
-4.9
+0.7
-12.5%
jan 1, 1990
5.7
+10.6
-216.33%
jan 1, 1991
-2.3
-8.0
-140.35%
jan 1, 1992
-3.1
-0.8
34.78%
jan 1, 1993
6.1
+9.2
-296.77%
jan 1, 1994
-1.9
-8.0
-131.15%
jan 1, 1995
0.8
+2.7
-142.11%
jan 1, 1996
2.7
+1.9
237.5%
jan 1, 1997
-0.4
-3.1
-114.82%
jan 1, 1998
-0.8
-0.4
100.0%
jan 1, 1999
2.4
+3.2
-400.0%
jan 1, 2000
2.8
+0.4
16.67%
jan 1, 2001
5.42
+2.62
93.57%
jan 1, 2002
3.708
-1.712
-31.59%
jan 1, 2003
6.046
+2.338
63.06%
jan 1, 2004
4.768
-1.278
-21.14%
jan 1, 2005
3.62
-1.147
-24.07%
jan 1, 2006
5.811
+2.19
60.49%
jan 1, 2007
2.596
-3.215
-55.33%
jan 1, 2008
6.095
+3.499
134.8%
jan 1, 2009
6.864
+0.769
12.62%
jan 1, 2010
-3.463
-10.327
-150.45%
jan 1, 2011
1.011
+4.474
-129.19%
jan 1, 2012
4.071
+3.06
302.67%
jan 1, 2013
9.368
+5.297
130.11%
jan 1, 2014
6.498
-2.869
-30.63%
jan 1, 2015
5.694
-0.804
-12.38%
Ranking of countries by current statistics by years


Comments: