29
/
en
AIzaSyAYiBZKx7MnpbEhh9jyipgxe19OcubqV5w
April 1, 2024
267941
Tunisia
TUN
true
2
1
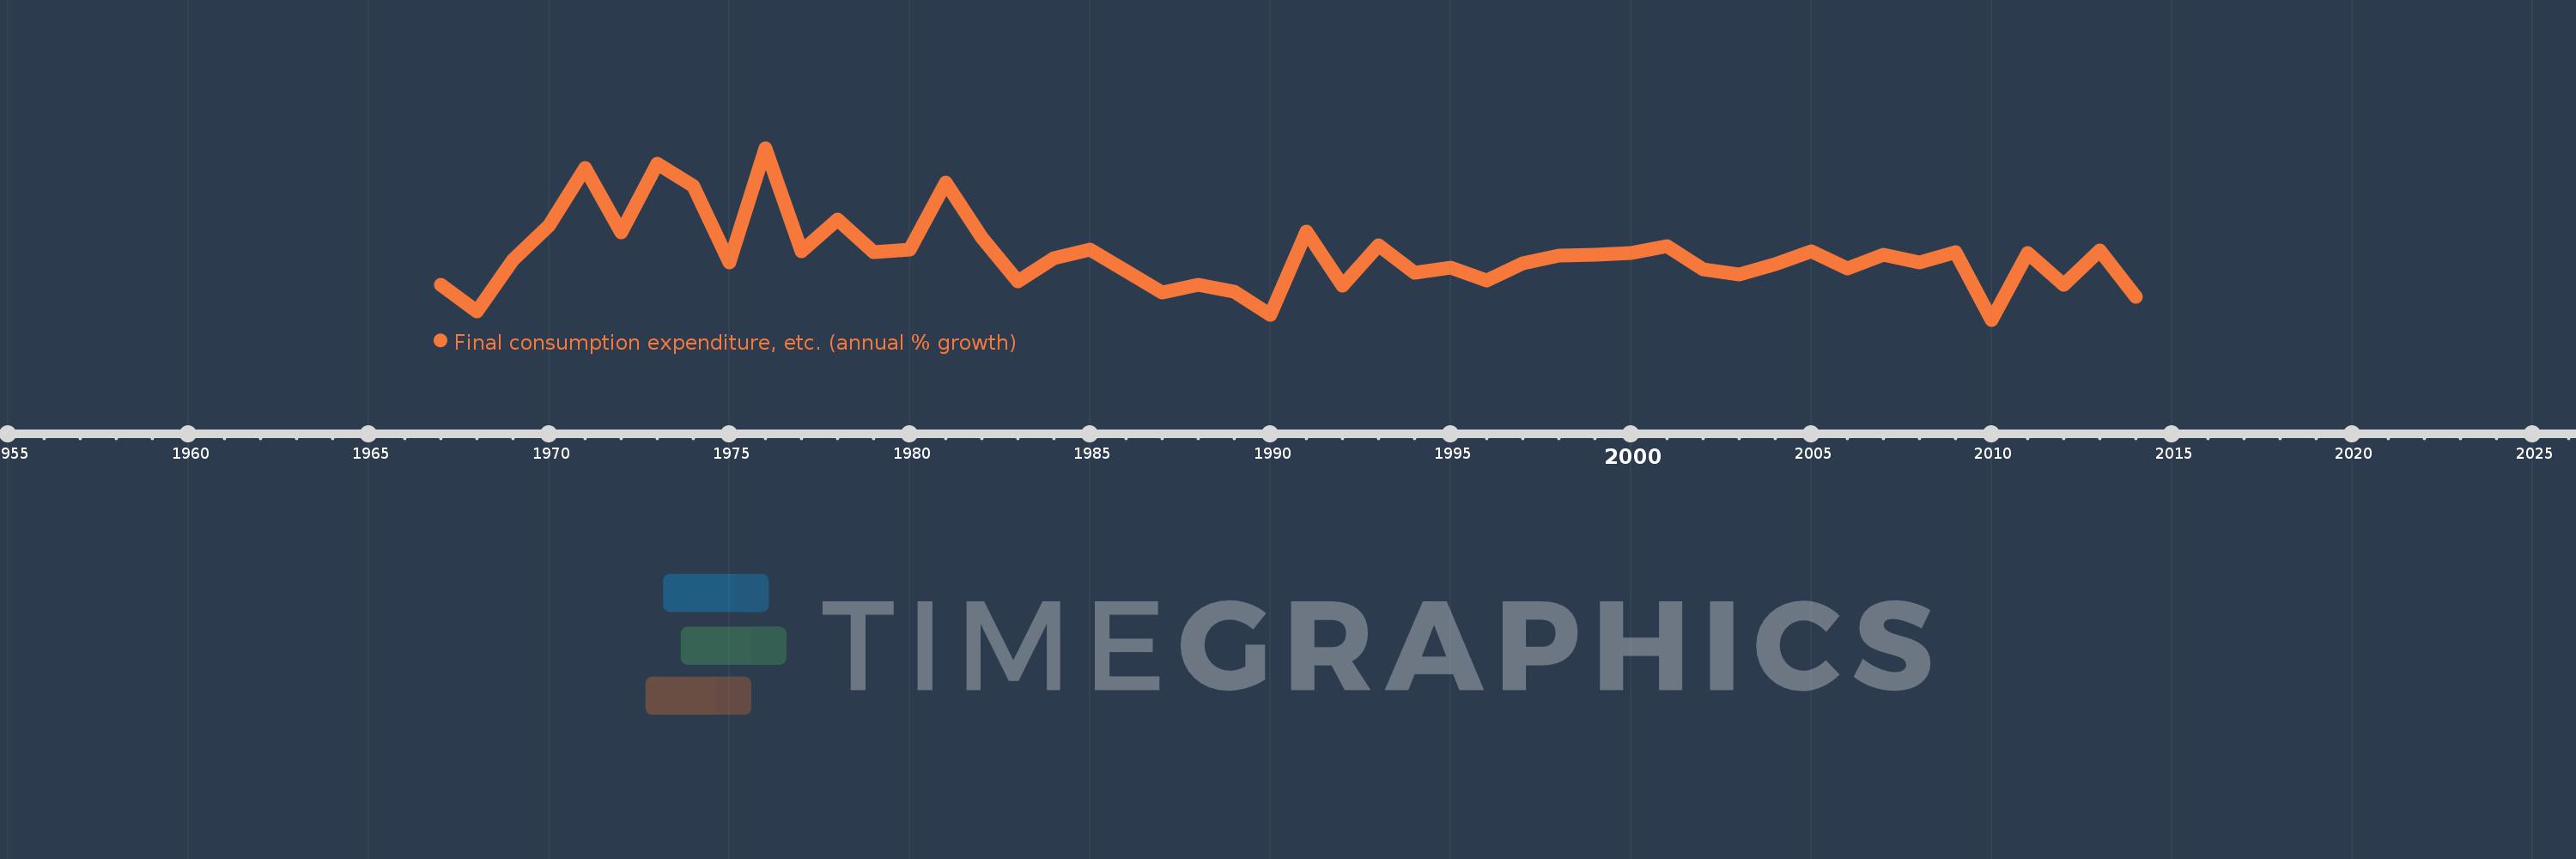
Final consumption expenditure, etc. (annual % growth)
2014,2013,2012,2011,2010,2009,2008,2007,2006,2005,2004,2003,2002,2001,2000,1999,1998,1997,1996,1995,1994,1993,1992,1991,1990,1989,1988,1987,1986,1985,1984,1983,1982,1981,1980,1979,1978,1977,1976,1975,1974,1973,1972,1971,1970,1969,1968,1967
This statistics in other country:
AlbaniaAlgeriaAntigua and BarbudaArab WorldArgentinaArmeniaAustraliaAustriaAzerbaijanBahamas, TheBahrainBangladeshBarbadosBelarusBelgiumBelizeBeninBhutanBoliviaBosnia and HerzegovinaBotswanaBrazilBrunei DarussalamBulgariaBurkina FasoBurundiCabo VerdeCambodiaCameroonCanadaCaribbean small statesCentral Europe and the BalticsChadChileColombiaComorosCongo, Dem. Rep.Congo, Rep.Costa RicaCote d'IvoireCroatiaCubaCyprusCzech RepublicDenmarkDjiboutiDominican RepublicEarly-demographic dividendEast Asia & PacificEcuadorEgypt, Arab Rep.El SalvadorEquatorial GuineaEritreaEstoniaEthiopiaEuro areaEurope & Central AsiaEurope & Central Asia (excluding high income)Europe & Central Asia (IDA & IBRD countries)European UnionFijiFinlandFranceGabonGambia, TheGeorgiaGermanyGhanaGreeceGuatemalaGuineaGuinea-BissauHaitiHeavily indebted poor countries (HIPC)High incomeHondurasHong Kong SAR, ChinaHungaryIBRD onlyIcelandIDA & IBRD totalIDA blendIDA onlyIDA totalIndiaIndonesiaIran, Islamic Rep.IrelandIsraelItalyJamaicaJapanJordanKazakhstanKenyaKorea, Rep.KosovoKuwaitKyrgyz RepublicLao PDRLatin America & Caribbean Latin America & Caribbean (excluding high income)Latin America & the Caribbean (IDA & IBRD countries)LatviaLeast developed countries: UN classificationLebanonLiberiaLithuaniaLow & middle incomeLow incomeLower middle incomeLuxembourgMacao SAR, ChinaMacedonia, FYRMadagascarMalawiMalaysiaMaliMaltaMauritaniaMauritiusMexicoMiddle East & North AfricaMiddle East & North Africa (excluding high income)Middle East & North Africa (IDA & IBRD countries)Middle incomeMoldovaMongoliaMontenegroMoroccoMozambiqueNamibiaNepalNetherlandsNew ZealandNicaraguaNigerNigeriaNorth AmericaNorwayOECD membersOmanOther small statesPakistanPanamaPapua New GuineaParaguayPeruPhilippinesPolandPortugalPost-demographic dividendPre-demographic dividendPuerto RicoQatarRomaniaRussian FederationRwandaSaudi ArabiaSenegalSerbiaSeychellesSierra LeoneSingaporeSlovak RepublicSloveniaSmall statesSomaliaSouth AfricaSouth AsiaSouth Asia (IDA & IBRD)South SudanSpainSri LankaSub-Saharan Africa Sub-Saharan Africa (excluding high income)Sub-Saharan Africa (IDA & IBRD countries)SudanSurinameSwazilandSwedenSwitzerlandSyrian Arab RepublicTajikistanTanzaniaThailandTimor-LesteTogoTrinidad and TobagoTunisiaTurkeyTurkmenistanUgandaUkraineUnited Arab EmiratesUnited KingdomUnited StatesUpper middle incomeUruguayUzbekistanVanuatuVenezuela, RBVietnamWest Bank and GazaWorldZimbabwe Timeline:
This timeline shows a graph from 1967 to 2014 of Tunisia. No data until 1966. Number of actual observations by date: 48.
Source name:
World Development Indicators
Source organization:
World Bank national accounts data, and OECD National Accounts data files.
Categories, topics:
Economy & Growth
Last updated:
apr 23, 2017
Indicators value changes by year
Minimum:
-0.677
jan 1, 2010
Maximum:
14.689
jan 1, 1976
At the date of observation
Value
Absolute change
Change from previous value
jan 1, 1967
2.487
+2.487
0.0%
jan 1, 1968
0.035
-2.452
-98.59%
jan 1, 1969
4.653
+4.618
13.13K%
jan 1, 1970
7.766
+3.113
66.89%
jan 1, 1971
12.877
+5.111
65.81%
jan 1, 1972
7.157
-5.72
-44.42%
jan 1, 1973
13.308
+6.151
85.94%
jan 1, 1974
11.251
-2.057
-15.45%
jan 1, 1975
4.45
-6.801
-60.44%
jan 1, 1976
14.689
+10.238
230.05%
jan 1, 1977
5.442
-9.247
-62.95%
jan 1, 1978
8.287
+2.846
52.3%
jan 1, 1979
5.338
-2.949
-35.58%
jan 1, 1980
5.627
+0.288
5.4%
jan 1, 1981
11.612
+5.985
106.38%
jan 1, 1982
6.664
-4.948
-42.61%
jan 1, 1983
2.754
-3.91
-58.68%
jan 1, 1984
4.823
+2.069
75.14%
jan 1, 1985
5.604
+0.781
16.2%
jan 1, 1986
3.653
-1.95
-34.81%
jan 1, 1987
1.748
-1.905
-52.14%
jan 1, 1988
2.475
+0.727
41.57%
jan 1, 1989
1.798
-0.678
-27.38%
jan 1, 1990
-0.225
-2.022
-112.5%
jan 1, 1991
7.19
+7.415
-3.3K%
jan 1, 1992
2.356
-4.834
-67.23%
jan 1, 1993
5.965
+3.609
153.16%
jan 1, 1994
3.524
-2.441
-40.92%
jan 1, 1995
3.976
+0.452
12.82%
jan 1, 1996
2.8
-1.176
-29.59%
jan 1, 1997
4.339
+1.539
54.98%
jan 1, 1998
5.057
+0.718
16.55%
jan 1, 1999
5.144
+0.087
1.73%
jan 1, 2000
5.3
+0.156
3.02%
jan 1, 2001
5.938
+0.638
12.03%
jan 1, 2002
3.867
-2.07
-34.86%
jan 1, 2003
3.36
-0.507
-13.12%
jan 1, 2004
4.311
+0.951
28.3%
jan 1, 2005
5.455
+1.144
26.54%
jan 1, 2006
3.913
-1.542
-28.27%
jan 1, 2007
5.127
+1.214
31.01%
jan 1, 2008
4.47
-0.657
-12.81%
jan 1, 2009
5.336
+0.866
19.38%
jan 1, 2010
-0.677
-6.013
-112.68%
jan 1, 2011
5.274
+5.95
-879.17%
jan 1, 2012
2.453
-2.821
-53.48%
jan 1, 2013
5.547
+3.094
126.12%
jan 1, 2014
1.363
-4.184
-75.43%
Ranking of countries by current statistics by years


Comments: