29
/
en
AIzaSyAYiBZKx7MnpbEhh9jyipgxe19OcubqV5w
April 1, 2024
276610
United States
USA
true
2
1
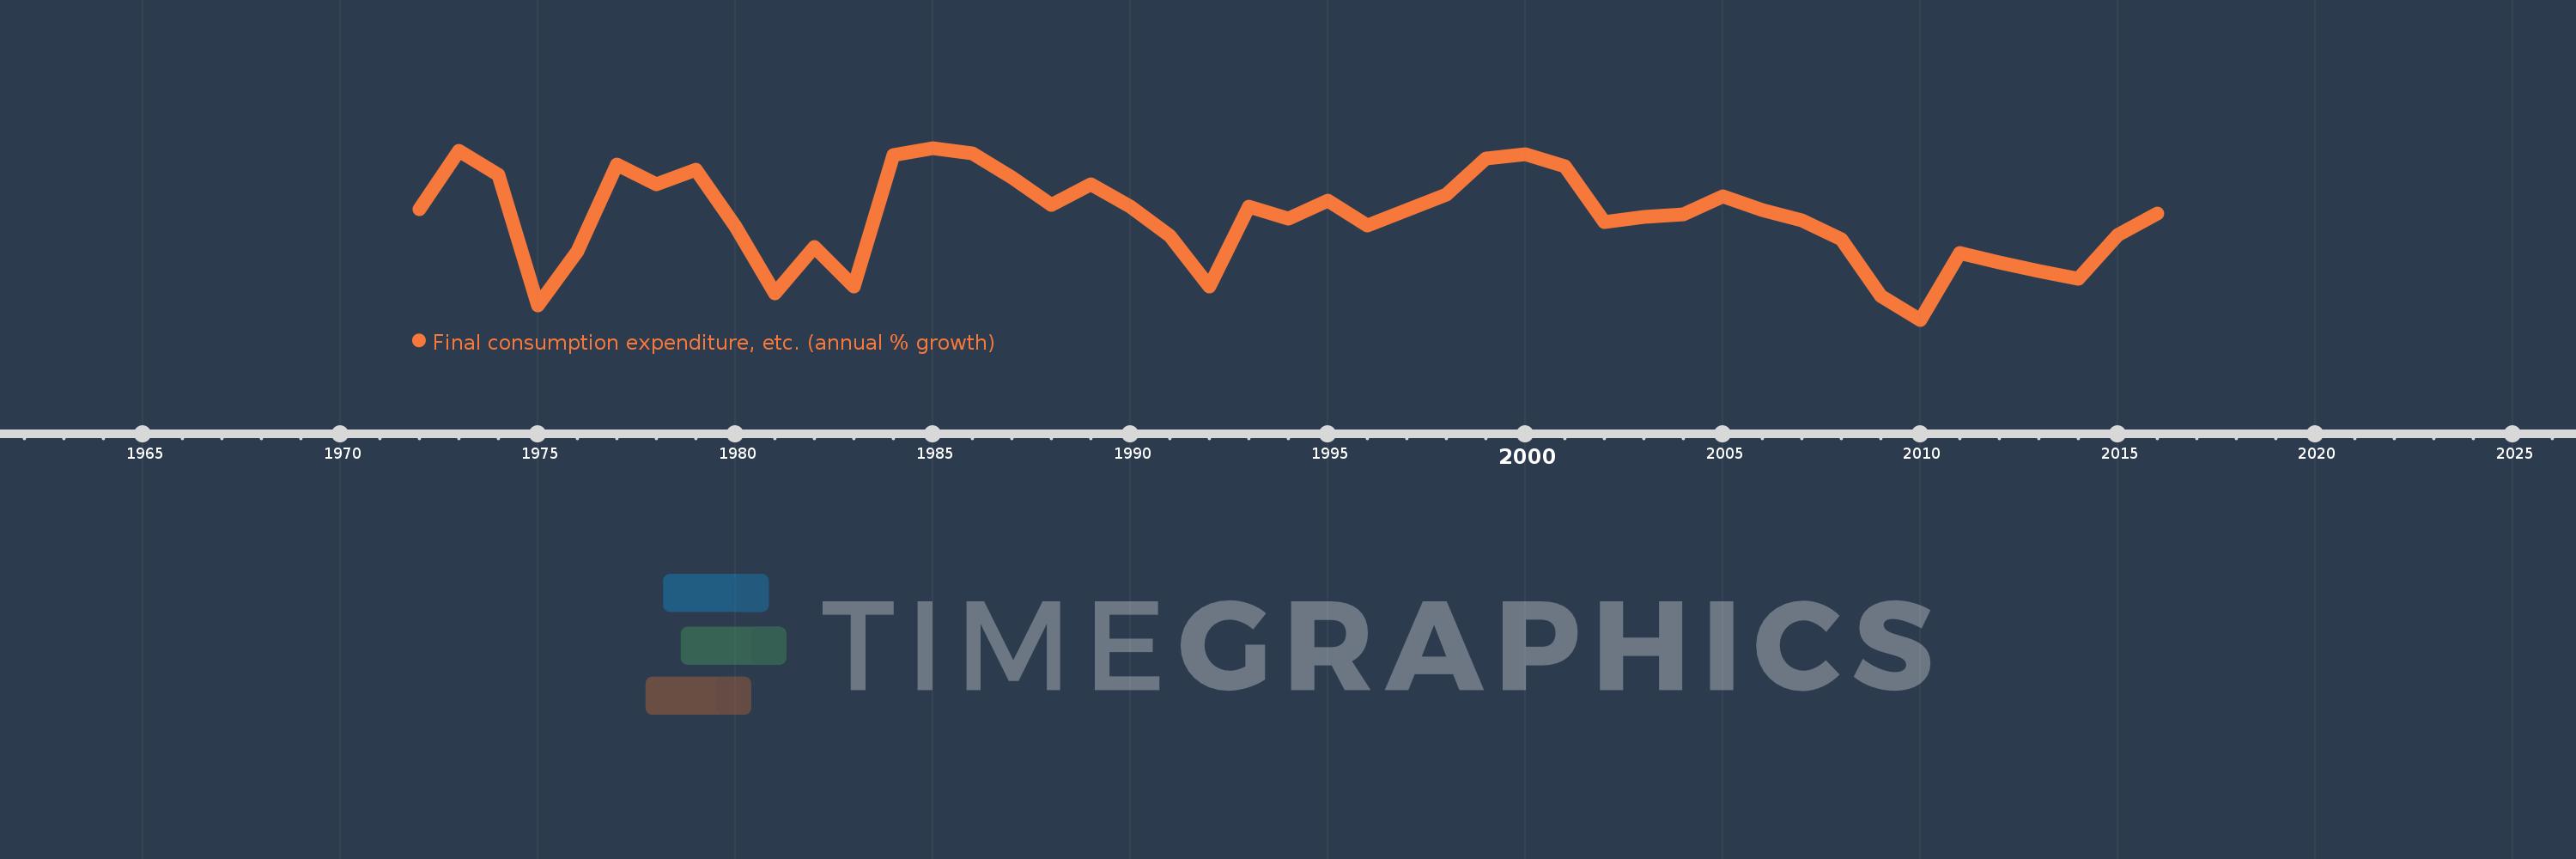
Final consumption expenditure, etc. (annual % growth)
2016,2015,2014,2013,2012,2011,2010,2009,2008,2007,2006,2005,2004,2003,2002,2001,2000,1999,1998,1997,1996,1995,1994,1993,1992,1991,1990,1989,1988,1987,1986,1985,1984,1983,1982,1981,1980,1979,1978,1977,1976,1975,1974,1973,1972
This statistics in other country:
AlbaniaAlgeriaAntigua and BarbudaArab WorldArgentinaArmeniaAustraliaAustriaAzerbaijanBahamas, TheBahrainBangladeshBarbadosBelarusBelgiumBelizeBeninBhutanBoliviaBosnia and HerzegovinaBotswanaBrazilBrunei DarussalamBulgariaBurkina FasoBurundiCabo VerdeCambodiaCameroonCanadaCaribbean small statesCentral Europe and the BalticsChadChileColombiaComorosCongo, Dem. Rep.Congo, Rep.Costa RicaCote d'IvoireCroatiaCubaCyprusCzech RepublicDenmarkDjiboutiDominican RepublicEarly-demographic dividendEast Asia & PacificEcuadorEgypt, Arab Rep.El SalvadorEquatorial GuineaEritreaEstoniaEthiopiaEuro areaEurope & Central AsiaEurope & Central Asia (excluding high income)Europe & Central Asia (IDA & IBRD countries)European UnionFijiFinlandFranceGabonGambia, TheGeorgiaGermanyGhanaGreeceGuatemalaGuineaGuinea-BissauHaitiHeavily indebted poor countries (HIPC)High incomeHondurasHong Kong SAR, ChinaHungaryIBRD onlyIcelandIDA & IBRD totalIDA blendIDA onlyIDA totalIndiaIndonesiaIran, Islamic Rep.IrelandIsraelItalyJamaicaJapanJordanKazakhstanKenyaKorea, Rep.KosovoKuwaitKyrgyz RepublicLao PDRLatin America & Caribbean Latin America & Caribbean (excluding high income)Latin America & the Caribbean (IDA & IBRD countries)LatviaLeast developed countries: UN classificationLebanonLiberiaLithuaniaLow & middle incomeLow incomeLower middle incomeLuxembourgMacao SAR, ChinaMacedonia, FYRMadagascarMalawiMalaysiaMaliMaltaMauritaniaMauritiusMexicoMiddle East & North AfricaMiddle East & North Africa (excluding high income)Middle East & North Africa (IDA & IBRD countries)Middle incomeMoldovaMongoliaMontenegroMoroccoMozambiqueNamibiaNepalNetherlandsNew ZealandNicaraguaNigerNigeriaNorth AmericaNorwayOECD membersOmanOther small statesPakistanPanamaPapua New GuineaParaguayPeruPhilippinesPolandPortugalPost-demographic dividendPre-demographic dividendPuerto RicoQatarRomaniaRussian FederationRwandaSaudi ArabiaSenegalSerbiaSeychellesSierra LeoneSingaporeSlovak RepublicSloveniaSmall statesSomaliaSouth AfricaSouth AsiaSouth Asia (IDA & IBRD)South SudanSpainSri LankaSub-Saharan Africa Sub-Saharan Africa (excluding high income)Sub-Saharan Africa (IDA & IBRD countries)SudanSurinameSwazilandSwedenSwitzerlandSyrian Arab RepublicTajikistanTanzaniaThailandTimor-LesteTogoTrinidad and TobagoTunisiaTurkeyTurkmenistanUgandaUkraineUnited Arab EmiratesUnited KingdomUnited StatesUpper middle incomeUruguayUzbekistanVanuatuVenezuela, RBVietnamWest Bank and GazaWorldZimbabwe Timeline:
This timeline shows a graph from 1972 to 2016 of United States. No data until 1971. Number of actual observations by date: 45.
Source name:
World Development Indicators
Source organization:
World Bank national accounts data, and OECD National Accounts data files.
Categories, topics:
Economy & Growth
Last updated:
apr 23, 2017
Indicators value changes by year
Minimum:
-0.635
jan 1, 2010
At the date of observation
Value
Absolute change
Change from previous value
jan 1, 1972
3.068
+3.068
0.0%
jan 1, 1973
5.017
+1.949
63.54%
jan 1, 1974
4.216
-0.801
-15.97%
jan 1, 1975
-0.157
-4.374
-103.73%
jan 1, 1976
1.669
+1.826
-1.16K%
jan 1, 1977
4.577
+2.908
174.21%
jan 1, 1978
3.899
-0.678
-14.82%
jan 1, 1979
4.402
+0.503
12.89%
jan 1, 1980
2.489
-1.912
-43.45%
jan 1, 1981
0.254
-2.235
-89.8%
jan 1, 1982
1.812
+1.558
613.65%
jan 1, 1983
0.486
-1.325
-73.16%
jan 1, 1984
4.873
+4.387
902.33%
jan 1, 1985
5.12
+0.247
5.07%
jan 1, 1986
4.947
-0.174
-3.4%
jan 1, 1987
4.128
-0.819
-16.56%
jan 1, 1988
3.205
-0.923
-22.36%
jan 1, 1989
3.914
+0.709
22.13%
jan 1, 1990
3.15
-0.764
-19.53%
jan 1, 1991
2.176
-0.973
-30.91%
jan 1, 1992
0.467
-1.709
-78.53%
jan 1, 1993
3.168
+2.701
577.97%
jan 1, 1994
2.748
-0.42
-13.25%
jan 1, 1995
3.343
+0.594
21.63%
jan 1, 1996
2.526
-0.817
-24.44%
jan 1, 1997
3.038
+0.512
20.27%
jan 1, 1998
3.551
+0.513
16.88%
jan 1, 1999
4.772
+1.221
34.38%
jan 1, 2000
4.91
+0.138
2.9%
jan 1, 2001
4.508
-0.402
-8.19%
jan 1, 2002
2.634
-1.874
-41.57%
jan 1, 2003
2.809
+0.175
6.64%
jan 1, 2004
2.908
+0.099
3.53%
jan 1, 2005
3.502
+0.594
20.43%
jan 1, 2006
3.044
-0.457
-13.06%
jan 1, 2007
2.693
-0.351
-11.54%
jan 1, 2008
2.047
-0.646
-23.98%
jan 1, 2009
0.166
-1.882
-91.9%
jan 1, 2010
-0.635
-0.801
-483.41%
jan 1, 2011
1.593
+2.228
-350.62%
jan 1, 2012
1.282
-0.311
-19.53%
jan 1, 2013
1.008
-0.273
-21.32%
jan 1, 2014
0.748
-0.26
-25.81%
jan 1, 2015
2.216
+1.468
196.2%
jan 1, 2016
2.937
+0.721
32.54%
Ranking of countries by current statistics by years


Comments: