29
/
en
AIzaSyAYiBZKx7MnpbEhh9jyipgxe19OcubqV5w
April 1, 2024
84046
Benin
BEN
true
2
1
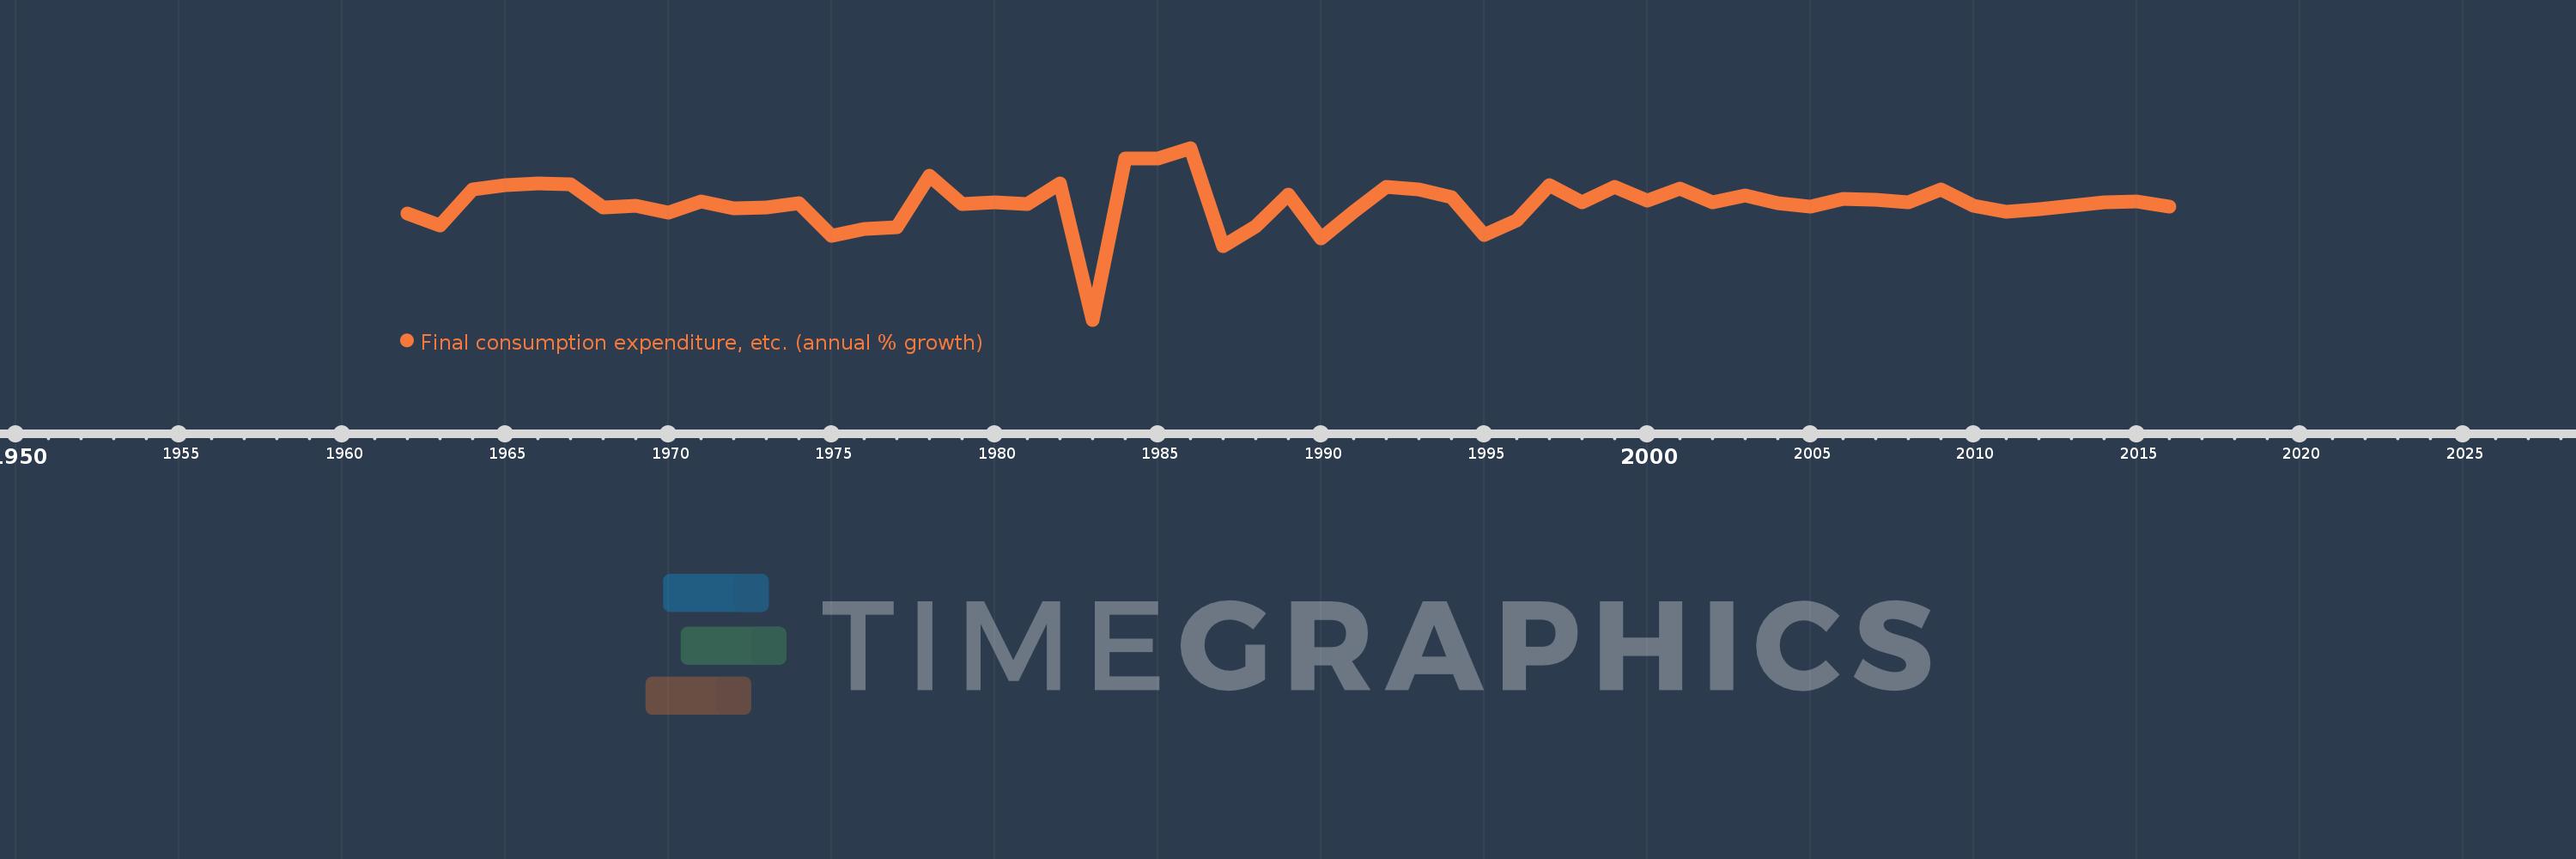
Final consumption expenditure, etc. (annual % growth)
2016,2015,2014,2013,2012,2011,2010,2009,2008,2007,2006,2005,2004,2003,2002,2001,2000,1999,1998,1997,1996,1995,1994,1993,1992,1991,1990,1989,1988,1987,1986,1985,1984,1983,1982,1981,1980,1979,1978,1977,1976,1975,1974,1973,1972,1971,1970,1969,1968,1967,1966,1965,1964,1963,1962
This statistics in other country:
AlbaniaAlgeriaAntigua and BarbudaArab WorldArgentinaArmeniaAustraliaAustriaAzerbaijanBahamas, TheBahrainBangladeshBarbadosBelarusBelgiumBelizeBeninBhutanBoliviaBosnia and HerzegovinaBotswanaBrazilBrunei DarussalamBulgariaBurkina FasoBurundiCabo VerdeCambodiaCameroonCanadaCaribbean small statesCentral Europe and the BalticsChadChileColombiaComorosCongo, Dem. Rep.Congo, Rep.Costa RicaCote d'IvoireCroatiaCubaCyprusCzech RepublicDenmarkDjiboutiDominican RepublicEarly-demographic dividendEast Asia & PacificEcuadorEgypt, Arab Rep.El SalvadorEquatorial GuineaEritreaEstoniaEthiopiaEuro areaEurope & Central AsiaEurope & Central Asia (excluding high income)Europe & Central Asia (IDA & IBRD countries)European UnionFijiFinlandFranceGabonGambia, TheGeorgiaGermanyGhanaGreeceGuatemalaGuineaGuinea-BissauHaitiHeavily indebted poor countries (HIPC)High incomeHondurasHong Kong SAR, ChinaHungaryIBRD onlyIcelandIDA & IBRD totalIDA blendIDA onlyIDA totalIndiaIndonesiaIran, Islamic Rep.IrelandIsraelItalyJamaicaJapanJordanKazakhstanKenyaKorea, Rep.KosovoKuwaitKyrgyz RepublicLao PDRLatin America & Caribbean Latin America & Caribbean (excluding high income)Latin America & the Caribbean (IDA & IBRD countries)LatviaLeast developed countries: UN classificationLebanonLiberiaLithuaniaLow & middle incomeLow incomeLower middle incomeLuxembourgMacao SAR, ChinaMacedonia, FYRMadagascarMalawiMalaysiaMaliMaltaMauritaniaMauritiusMexicoMiddle East & North AfricaMiddle East & North Africa (excluding high income)Middle East & North Africa (IDA & IBRD countries)Middle incomeMoldovaMongoliaMontenegroMoroccoMozambiqueNamibiaNepalNetherlandsNew ZealandNicaraguaNigerNigeriaNorth AmericaNorwayOECD membersOmanOther small statesPakistanPanamaPapua New GuineaParaguayPeruPhilippinesPolandPortugalPost-demographic dividendPre-demographic dividendPuerto RicoQatarRomaniaRussian FederationRwandaSaudi ArabiaSenegalSerbiaSeychellesSierra LeoneSingaporeSlovak RepublicSloveniaSmall statesSomaliaSouth AfricaSouth AsiaSouth Asia (IDA & IBRD)South SudanSpainSri LankaSub-Saharan Africa Sub-Saharan Africa (excluding high income)Sub-Saharan Africa (IDA & IBRD countries)SudanSurinameSwazilandSwedenSwitzerlandSyrian Arab RepublicTajikistanTanzaniaThailandTimor-LesteTogoTrinidad and TobagoTunisiaTurkeyTurkmenistanUgandaUkraineUnited Arab EmiratesUnited KingdomUnited StatesUpper middle incomeUruguayUzbekistanVanuatuVenezuela, RBVietnamWest Bank and GazaWorldZimbabwe Timeline:
This timeline shows a graph from 1962 to 2016 of Benin. No data until 1961. Number of actual observations by date: 55.
Source name:
World Development Indicators
Source organization:
World Bank national accounts data, and OECD National Accounts data files.
Categories, topics:
Economy & Growth
Last updated:
apr 23, 2017
Indicators value changes by year
Minimum:
-23.995
jan 1, 1983
Maximum:
16.838
jan 1, 1986
At the date of observation
Value
Absolute change
Change from previous value
jan 1, 1962
1.28
+1.28
0.0%
jan 1, 1963
-1.561
-2.84
-221.99%
jan 1, 1964
6.887
+8.448
-541.2%
jan 1, 1965
8.03
+1.143
16.6%
jan 1, 1966
8.378
+0.348
4.33%
jan 1, 1967
8.172
-0.206
-2.46%
jan 1, 1968
2.784
-5.388
-65.94%
jan 1, 1969
3.082
+0.299
10.73%
jan 1, 1970
1.534
-1.548
-50.23%
jan 1, 1971
4.125
+2.591
168.89%
jan 1, 1972
2.413
-1.712
-41.5%
jan 1, 1973
2.612
+0.199
8.26%
jan 1, 1974
3.622
+1.01
38.64%
jan 1, 1975
-4.122
-7.744
-213.8%
jan 1, 1976
-2.388
+1.734
-42.06%
jan 1, 1977
-2.103
+0.285
-11.95%
jan 1, 1978
10.153
+12.256
-582.78%
jan 1, 1979
3.595
-6.558
-64.59%
jan 1, 1980
3.954
+0.358
9.96%
jan 1, 1981
3.462
-0.492
-12.44%
jan 1, 1982
8.347
+4.885
141.12%
jan 1, 1983
-23.995
-32.342
-387.47%
jan 1, 1984
14.28
+38.274
-159.51%
jan 1, 1985
14.282
+0.002
0.02%
jan 1, 1986
16.838
+2.556
17.9%
jan 1, 1987
-6.498
-23.336
-138.59%
jan 1, 1988
-1.714
+4.784
-73.62%
jan 1, 1989
5.67
+7.384
-430.69%
jan 1, 1990
-4.663
-10.333
-182.25%
jan 1, 1991
1.628
+6.291
-134.9%
jan 1, 1992
7.574
+5.946
365.34%
jan 1, 1993
7.014
-0.56
-7.4%
jan 1, 1994
5.202
-1.811
-25.83%
jan 1, 1995
-3.764
-8.966
-172.34%
jan 1, 1996
-0.45
+3.313
-88.04%
jan 1, 1997
7.995
+8.445
-1.88K%
jan 1, 1998
3.904
-4.091
-51.17%
jan 1, 1999
7.539
+3.635
93.12%
jan 1, 2000
4.316
-3.223
-42.75%
jan 1, 2001
7.201
+2.885
66.85%
jan 1, 2002
3.895
-3.306
-45.91%
jan 1, 2003
5.545
+1.65
42.36%
jan 1, 2004
3.801
-1.744
-31.45%
jan 1, 2005
2.881
-0.92
-24.19%
jan 1, 2006
4.686
+1.804
62.62%
jan 1, 2007
4.536
-0.15
-3.2%
jan 1, 2008
3.905
-0.632
-13.92%
jan 1, 2009
6.963
+3.058
78.33%
jan 1, 2010
3.17
-3.793
-54.47%
jan 1, 2011
1.631
-1.539
-48.55%
jan 1, 2012
2.274
+0.643
39.39%
jan 1, 2013
3.114
+0.841
36.98%
jan 1, 2014
3.925
+0.81
26.02%
jan 1, 2015
4.159
+0.234
5.96%
jan 1, 2016
2.846
-1.313
-31.57%
Ranking of countries by current statistics by years


Comments: