29
/
en
AIzaSyAYiBZKx7MnpbEhh9jyipgxe19OcubqV5w
April 1, 2024
57014
South Asia
SAS
false
2
1
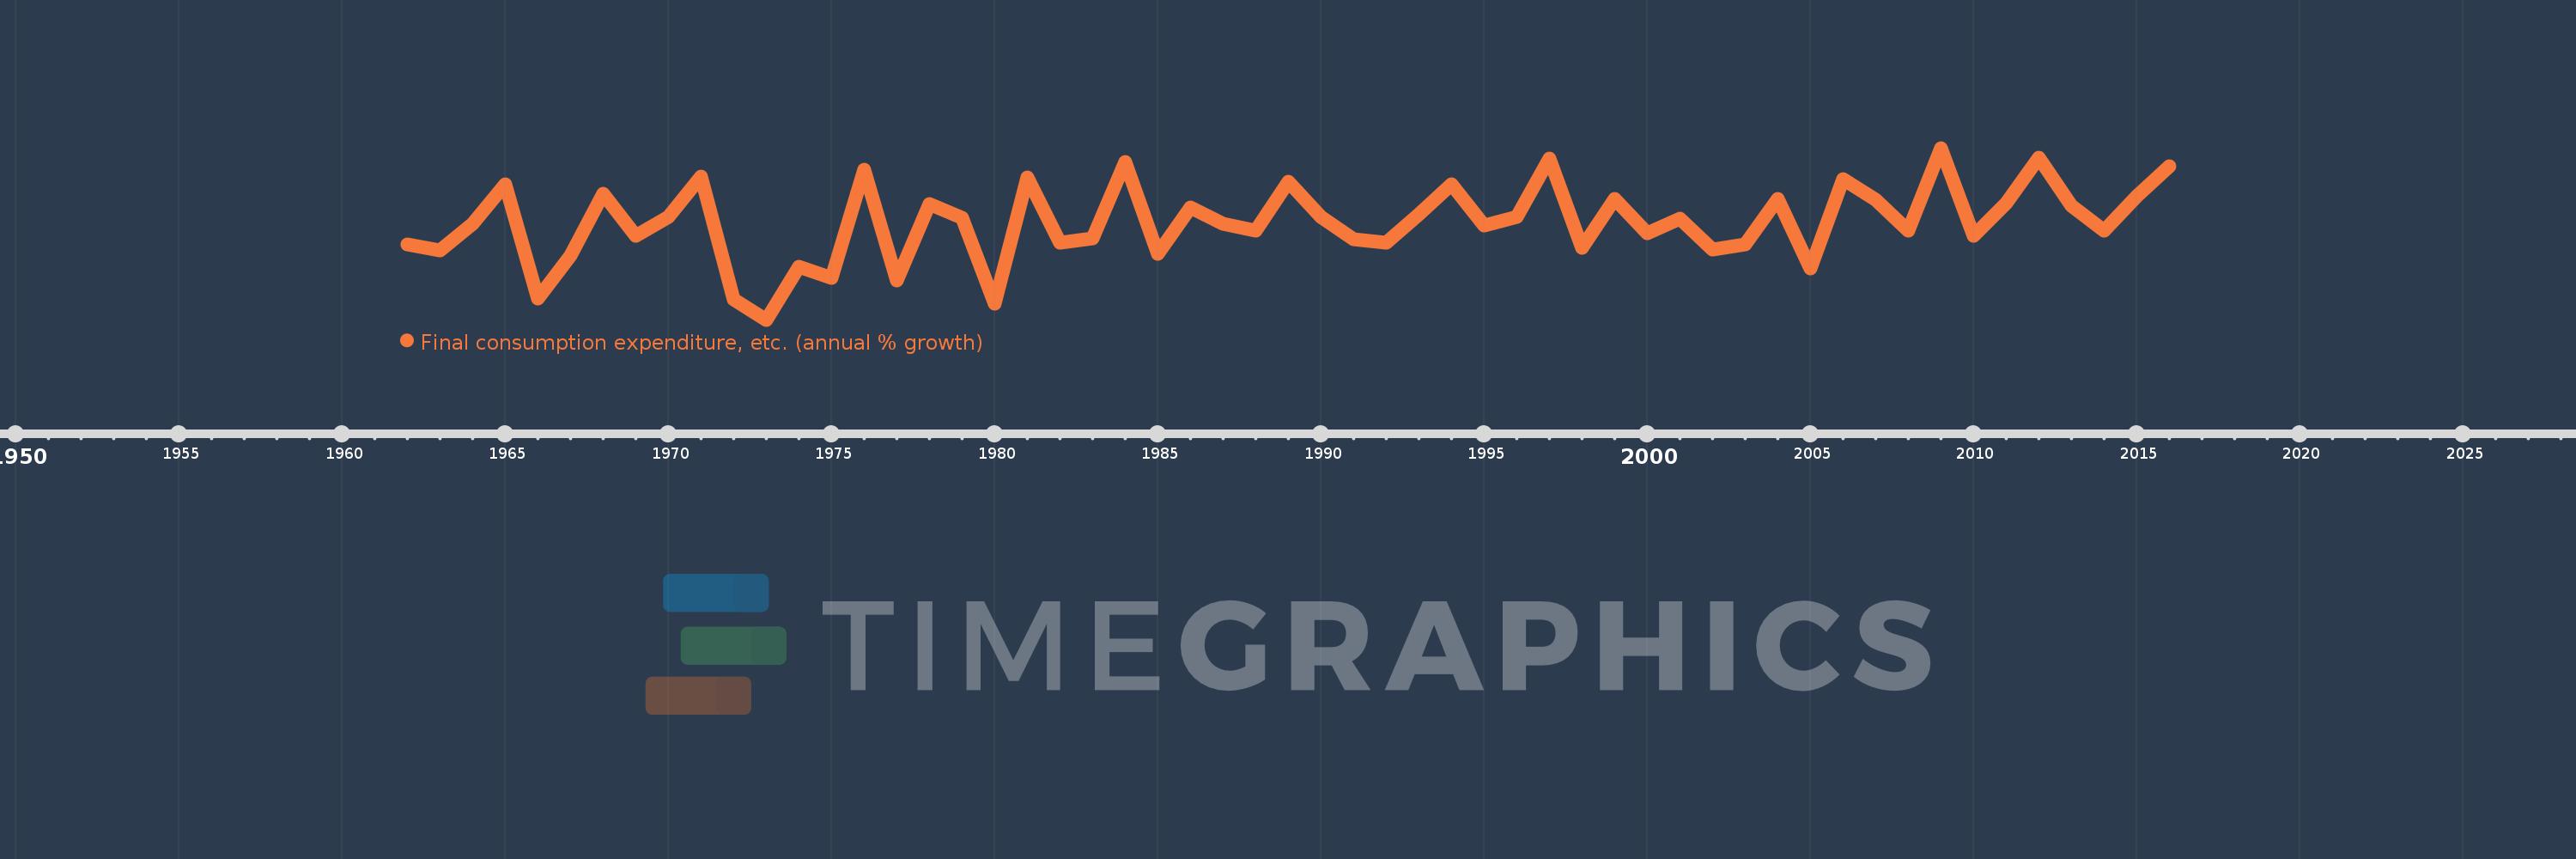
Final consumption expenditure, etc. (annual % growth)
2016,2015,2014,2013,2012,2011,2010,2009,2008,2007,2006,2005,2004,2003,2002,2001,2000,1999,1998,1997,1996,1995,1994,1993,1992,1991,1990,1989,1988,1987,1986,1985,1984,1983,1982,1981,1980,1979,1978,1977,1976,1975,1974,1973,1972,1971,1970,1969,1968,1967,1966,1965,1964,1963,1962
This statistics in other country:
AlbaniaAlgeriaAntigua and BarbudaArab WorldArgentinaArmeniaAustraliaAustriaAzerbaijanBahamas, TheBahrainBangladeshBarbadosBelarusBelgiumBelizeBeninBhutanBoliviaBosnia and HerzegovinaBotswanaBrazilBrunei DarussalamBulgariaBurkina FasoBurundiCabo VerdeCambodiaCameroonCanadaCaribbean small statesCentral Europe and the BalticsChadChileColombiaComorosCongo, Dem. Rep.Congo, Rep.Costa RicaCote d'IvoireCroatiaCubaCyprusCzech RepublicDenmarkDjiboutiDominican RepublicEarly-demographic dividendEast Asia & PacificEcuadorEgypt, Arab Rep.El SalvadorEquatorial GuineaEritreaEstoniaEthiopiaEuro areaEurope & Central AsiaEurope & Central Asia (excluding high income)Europe & Central Asia (IDA & IBRD countries)European UnionFijiFinlandFranceGabonGambia, TheGeorgiaGermanyGhanaGreeceGuatemalaGuineaGuinea-BissauHaitiHeavily indebted poor countries (HIPC)High incomeHondurasHong Kong SAR, ChinaHungaryIBRD onlyIcelandIDA & IBRD totalIDA blendIDA onlyIDA totalIndiaIndonesiaIran, Islamic Rep.IrelandIsraelItalyJamaicaJapanJordanKazakhstanKenyaKorea, Rep.KosovoKuwaitKyrgyz RepublicLao PDRLatin America & Caribbean Latin America & Caribbean (excluding high income)Latin America & the Caribbean (IDA & IBRD countries)LatviaLeast developed countries: UN classificationLebanonLiberiaLithuaniaLow & middle incomeLow incomeLower middle incomeLuxembourgMacao SAR, ChinaMacedonia, FYRMadagascarMalawiMalaysiaMaliMaltaMauritaniaMauritiusMexicoMiddle East & North AfricaMiddle East & North Africa (excluding high income)Middle East & North Africa (IDA & IBRD countries)Middle incomeMoldovaMongoliaMontenegroMoroccoMozambiqueNamibiaNepalNetherlandsNew ZealandNicaraguaNigerNigeriaNorth AmericaNorwayOECD membersOmanOther small statesPakistanPanamaPapua New GuineaParaguayPeruPhilippinesPolandPortugalPost-demographic dividendPre-demographic dividendPuerto RicoQatarRomaniaRussian FederationRwandaSaudi ArabiaSenegalSerbiaSeychellesSierra LeoneSingaporeSlovak RepublicSloveniaSmall statesSomaliaSouth AfricaSouth AsiaSouth Asia (IDA & IBRD)South SudanSpainSri LankaSub-Saharan Africa Sub-Saharan Africa (excluding high income)Sub-Saharan Africa (IDA & IBRD countries)SudanSurinameSwazilandSwedenSwitzerlandSyrian Arab RepublicTajikistanTanzaniaThailandTimor-LesteTogoTrinidad and TobagoTunisiaTurkeyTurkmenistanUgandaUkraineUnited Arab EmiratesUnited KingdomUnited StatesUpper middle incomeUruguayUzbekistanVanuatuVenezuela, RBVietnamWest Bank and GazaWorldZimbabwe Timeline:
This timeline shows a graph from 1962 to 2016 of South Asia. No data until 1961. Number of actual observations by date: 55.
Source name:
World Development Indicators
Source organization:
World Bank national accounts data, and OECD National Accounts data files.
Categories, topics:
Economy & Growth
Last updated:
apr 23, 2017
Indicators value changes by year
Minimum:
-3.359
jan 1, 1973
Maximum:
10.767
jan 1, 2009
At the date of observation
Value
Absolute change
Change from previous value
jan 1, 1962
2.85
+2.85
0.0%
jan 1, 1963
2.312
-0.538
-18.88%
jan 1, 1964
4.561
+2.249
97.26%
jan 1, 1965
7.806
+3.245
71.16%
jan 1, 1966
-1.6
-9.406
-120.5%
jan 1, 1967
1.924
+3.524
-220.21%
jan 1, 1968
6.992
+5.068
263.43%
jan 1, 1969
3.549
-3.443
-49.24%
jan 1, 1970
5.103
+1.554
43.78%
jan 1, 1971
8.402
+3.299
64.65%
jan 1, 1972
-1.719
-10.121
-120.45%
jan 1, 1973
-3.359
-1.64
95.44%
jan 1, 1974
1.007
+4.366
-129.99%
jan 1, 1975
0.058
-0.949
-94.24%
jan 1, 1976
8.975
+8.917
15.37K%
jan 1, 1977
-0.14
-9.115
-101.56%
jan 1, 1978
6.158
+6.298
-4.5K%
jan 1, 1979
5.003
-1.156
-18.77%
jan 1, 1980
-2.059
-7.062
-141.17%
jan 1, 1981
8.315
+10.374
-503.73%
jan 1, 1982
2.962
-5.353
-64.38%
jan 1, 1983
3.324
+0.363
12.24%
jan 1, 1984
9.619
+6.294
189.35%
jan 1, 1985
2.044
-7.575
-78.75%
jan 1, 1986
5.866
+3.823
187.07%
jan 1, 1987
4.535
-1.332
-22.7%
jan 1, 1988
3.985
-0.55
-12.13%
jan 1, 1989
7.993
+4.009
100.61%
jan 1, 1990
5.076
-2.917
-36.5%
jan 1, 1991
3.27
-1.806
-35.59%
jan 1, 1992
2.976
-0.294
-9.0%
jan 1, 1993
5.298
+2.323
78.05%
jan 1, 1994
7.806
+2.508
47.33%
jan 1, 1995
4.41
-3.396
-43.51%
jan 1, 1996
5.087
+0.677
15.36%
jan 1, 1997
9.891
+4.804
94.44%
jan 1, 1998
2.578
-7.313
-73.94%
jan 1, 1999
6.613
+4.035
156.53%
jan 1, 2000
3.784
-2.83
-42.79%
jan 1, 2001
4.984
+1.201
31.73%
jan 1, 2002
2.445
-2.539
-50.95%
jan 1, 2003
2.809
+0.364
14.89%
jan 1, 2004
6.565
+3.756
133.7%
jan 1, 2005
0.84
-5.725
-87.21%
jan 1, 2006
8.172
+7.332
873.12%
jan 1, 2007
6.502
-1.669
-20.43%
jan 1, 2008
3.962
-2.54
-39.06%
jan 1, 2009
10.767
+6.805
171.74%
jan 1, 2010
3.524
-7.243
-67.27%
jan 1, 2011
6.219
+2.695
76.49%
jan 1, 2012
9.965
+3.745
60.22%
jan 1, 2013
5.993
-3.972
-39.86%
jan 1, 2014
3.974
-2.019
-33.69%
jan 1, 2015
6.825
+2.85
71.72%
jan 1, 2016
9.233
+2.409
35.29%
Ranking of countries by current statistics by years


Comments: