29
/
en
AIzaSyAYiBZKx7MnpbEhh9jyipgxe19OcubqV5w
April 1, 2024
262202
Thailand
THA
true
2
1
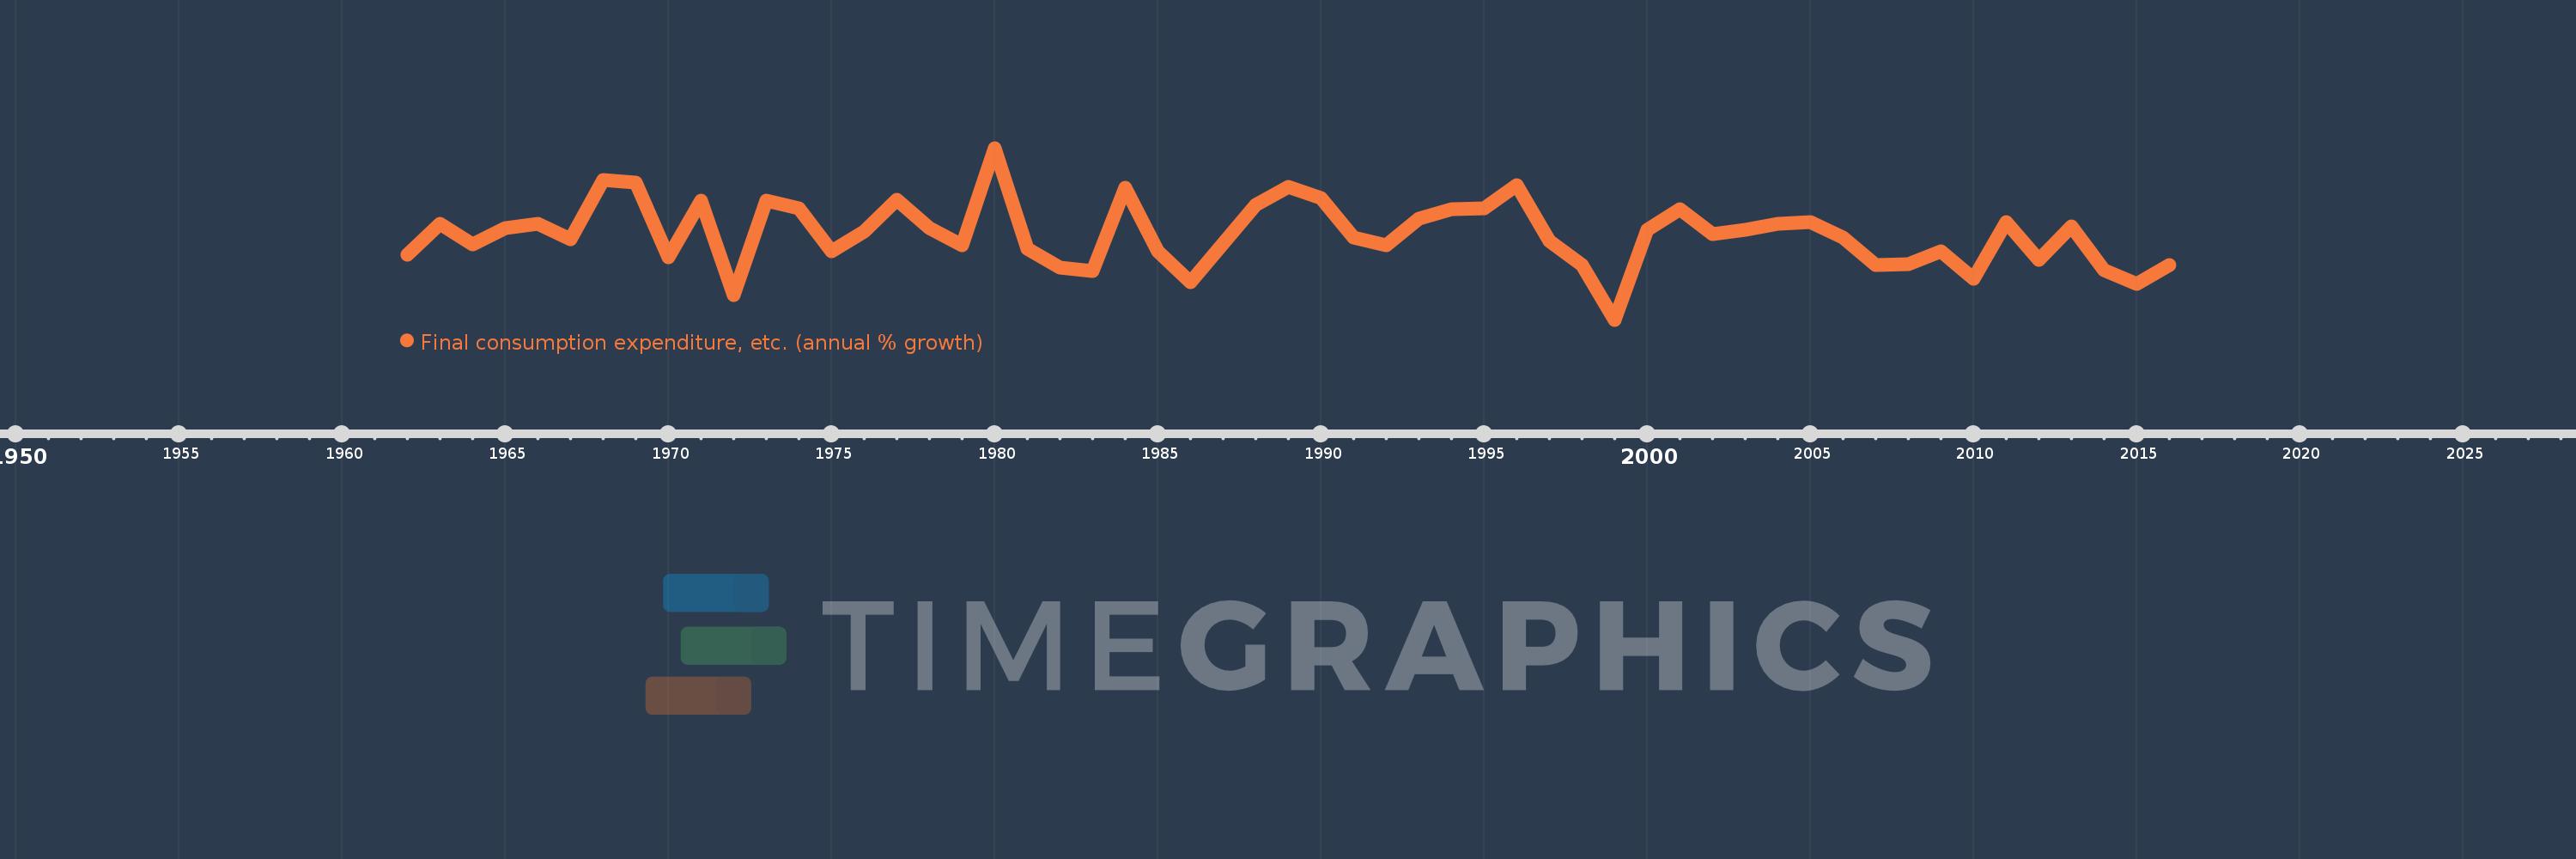
Final consumption expenditure, etc. (annual % growth)
2016,2015,2014,2013,2012,2011,2010,2009,2008,2007,2006,2005,2004,2003,2002,2001,2000,1999,1998,1997,1996,1995,1994,1993,1992,1991,1990,1989,1988,1987,1986,1985,1984,1983,1982,1981,1980,1979,1978,1977,1976,1975,1974,1973,1972,1971,1970,1969,1968,1967,1966,1965,1964,1963,1962
This statistics in other country:
AlbaniaAlgeriaAntigua and BarbudaArab WorldArgentinaArmeniaAustraliaAustriaAzerbaijanBahamas, TheBahrainBangladeshBarbadosBelarusBelgiumBelizeBeninBhutanBoliviaBosnia and HerzegovinaBotswanaBrazilBrunei DarussalamBulgariaBurkina FasoBurundiCabo VerdeCambodiaCameroonCanadaCaribbean small statesCentral Europe and the BalticsChadChileColombiaComorosCongo, Dem. Rep.Congo, Rep.Costa RicaCote d'IvoireCroatiaCubaCyprusCzech RepublicDenmarkDjiboutiDominican RepublicEarly-demographic dividendEast Asia & PacificEcuadorEgypt, Arab Rep.El SalvadorEquatorial GuineaEritreaEstoniaEthiopiaEuro areaEurope & Central AsiaEurope & Central Asia (excluding high income)Europe & Central Asia (IDA & IBRD countries)European UnionFijiFinlandFranceGabonGambia, TheGeorgiaGermanyGhanaGreeceGuatemalaGuineaGuinea-BissauHaitiHeavily indebted poor countries (HIPC)High incomeHondurasHong Kong SAR, ChinaHungaryIBRD onlyIcelandIDA & IBRD totalIDA blendIDA onlyIDA totalIndiaIndonesiaIran, Islamic Rep.IrelandIsraelItalyJamaicaJapanJordanKazakhstanKenyaKorea, Rep.KosovoKuwaitKyrgyz RepublicLao PDRLatin America & Caribbean Latin America & Caribbean (excluding high income)Latin America & the Caribbean (IDA & IBRD countries)LatviaLeast developed countries: UN classificationLebanonLiberiaLithuaniaLow & middle incomeLow incomeLower middle incomeLuxembourgMacao SAR, ChinaMacedonia, FYRMadagascarMalawiMalaysiaMaliMaltaMauritaniaMauritiusMexicoMiddle East & North AfricaMiddle East & North Africa (excluding high income)Middle East & North Africa (IDA & IBRD countries)Middle incomeMoldovaMongoliaMontenegroMoroccoMozambiqueNamibiaNepalNetherlandsNew ZealandNicaraguaNigerNigeriaNorth AmericaNorwayOECD membersOmanOther small statesPakistanPanamaPapua New GuineaParaguayPeruPhilippinesPolandPortugalPost-demographic dividendPre-demographic dividendPuerto RicoQatarRomaniaRussian FederationRwandaSaudi ArabiaSenegalSerbiaSeychellesSierra LeoneSingaporeSlovak RepublicSloveniaSmall statesSomaliaSouth AfricaSouth AsiaSouth Asia (IDA & IBRD)South SudanSpainSri LankaSub-Saharan Africa Sub-Saharan Africa (excluding high income)Sub-Saharan Africa (IDA & IBRD countries)SudanSurinameSwazilandSwedenSwitzerlandSyrian Arab RepublicTajikistanTanzaniaThailandTimor-LesteTogoTrinidad and TobagoTunisiaTurkeyTurkmenistanUgandaUkraineUnited Arab EmiratesUnited KingdomUnited StatesUpper middle incomeUruguayUzbekistanVanuatuVenezuela, RBVietnamWest Bank and GazaWorldZimbabwe Timeline:
This timeline shows a graph from 1962 to 2016 of Thailand. No data until 1961. Number of actual observations by date: 55.
Source name:
World Development Indicators
Source organization:
World Bank national accounts data, and OECD National Accounts data files.
Categories, topics:
Economy & Growth
Last updated:
apr 23, 2017
Indicators value changes by year
Minimum:
-4.318
jan 1, 1999
Maximum:
15.687
jan 1, 1980
At the date of observation
Value
Absolute change
Change from previous value
jan 1, 1962
3.256
+3.256
0.0%
jan 1, 1963
6.869
+3.614
111.0%
jan 1, 1964
4.488
-2.381
-34.66%
jan 1, 1965
6.355
+1.867
41.59%
jan 1, 1966
6.851
+0.496
7.8%
jan 1, 1967
5.088
-1.763
-25.73%
jan 1, 1968
11.92
+6.832
134.26%
jan 1, 1969
11.61
-0.31
-2.6%
jan 1, 1970
2.949
-8.661
-74.6%
jan 1, 1971
9.604
+6.655
225.63%
jan 1, 1972
-1.439
-11.043
-114.98%
jan 1, 1973
9.592
+11.031
-766.72%
jan 1, 1974
8.678
-0.914
-9.52%
jan 1, 1975
3.612
-5.066
-58.38%
jan 1, 1976
5.946
+2.334
64.61%
jan 1, 1977
9.667
+3.721
62.58%
jan 1, 1978
6.308
-3.36
-34.75%
jan 1, 1979
4.401
-1.907
-30.23%
jan 1, 1980
15.687
+11.286
256.47%
jan 1, 1981
3.93
-11.757
-74.95%
jan 1, 1982
1.721
-2.209
-56.21%
jan 1, 1983
1.396
-0.325
-18.86%
jan 1, 1984
11.065
+9.669
692.45%
jan 1, 1985
3.674
-7.391
-66.8%
jan 1, 1986
0.037
-3.637
-98.99%
jan 1, 1987
4.531
+4.494
12.1K%
jan 1, 1988
9.067
+4.537
100.13%
jan 1, 1989
11.199
+2.132
23.51%
jan 1, 1990
9.857
-1.342
-11.98%
jan 1, 1991
5.253
-4.605
-46.71%
jan 1, 1992
4.306
-0.947
-18.03%
jan 1, 1993
7.478
+3.172
73.67%
jan 1, 1994
8.546
+1.068
14.29%
jan 1, 1995
8.608
+0.061
0.72%
jan 1, 1996
11.318
+2.71
31.48%
jan 1, 1997
4.893
-6.425
-56.77%
jan 1, 1998
2.068
-2.825
-57.73%
jan 1, 1999
-4.318
-6.386
-308.77%
jan 1, 2000
6.199
+10.517
-243.56%
jan 1, 2001
8.56
+2.362
38.1%
jan 1, 2002
5.636
-2.924
-34.16%
jan 1, 2003
6.106
+0.47
8.33%
jan 1, 2004
6.883
+0.778
12.74%
jan 1, 2005
7.012
+0.129
1.87%
jan 1, 2006
5.222
-1.79
-25.52%
jan 1, 2007
2.076
-3.146
-60.24%
jan 1, 2008
2.197
+0.121
5.82%
jan 1, 2009
3.659
+1.461
66.51%
jan 1, 2010
0.434
-3.225
-88.14%
jan 1, 2011
7.052
+6.618
1.53K%
jan 1, 2012
2.701
-4.352
-61.71%
jan 1, 2013
6.58
+3.88
143.67%
jan 1, 2014
1.466
-5.114
-77.72%
jan 1, 2015
-0.099
-1.565
-106.76%
jan 1, 2016
2.047
+2.146
-2.17K%
Ranking of countries by current statistics by years


Comments: