29
/
en
AIzaSyAYiBZKx7MnpbEhh9jyipgxe19OcubqV5w
April 1, 2024
195507
Mexico
MEX
true
2
1
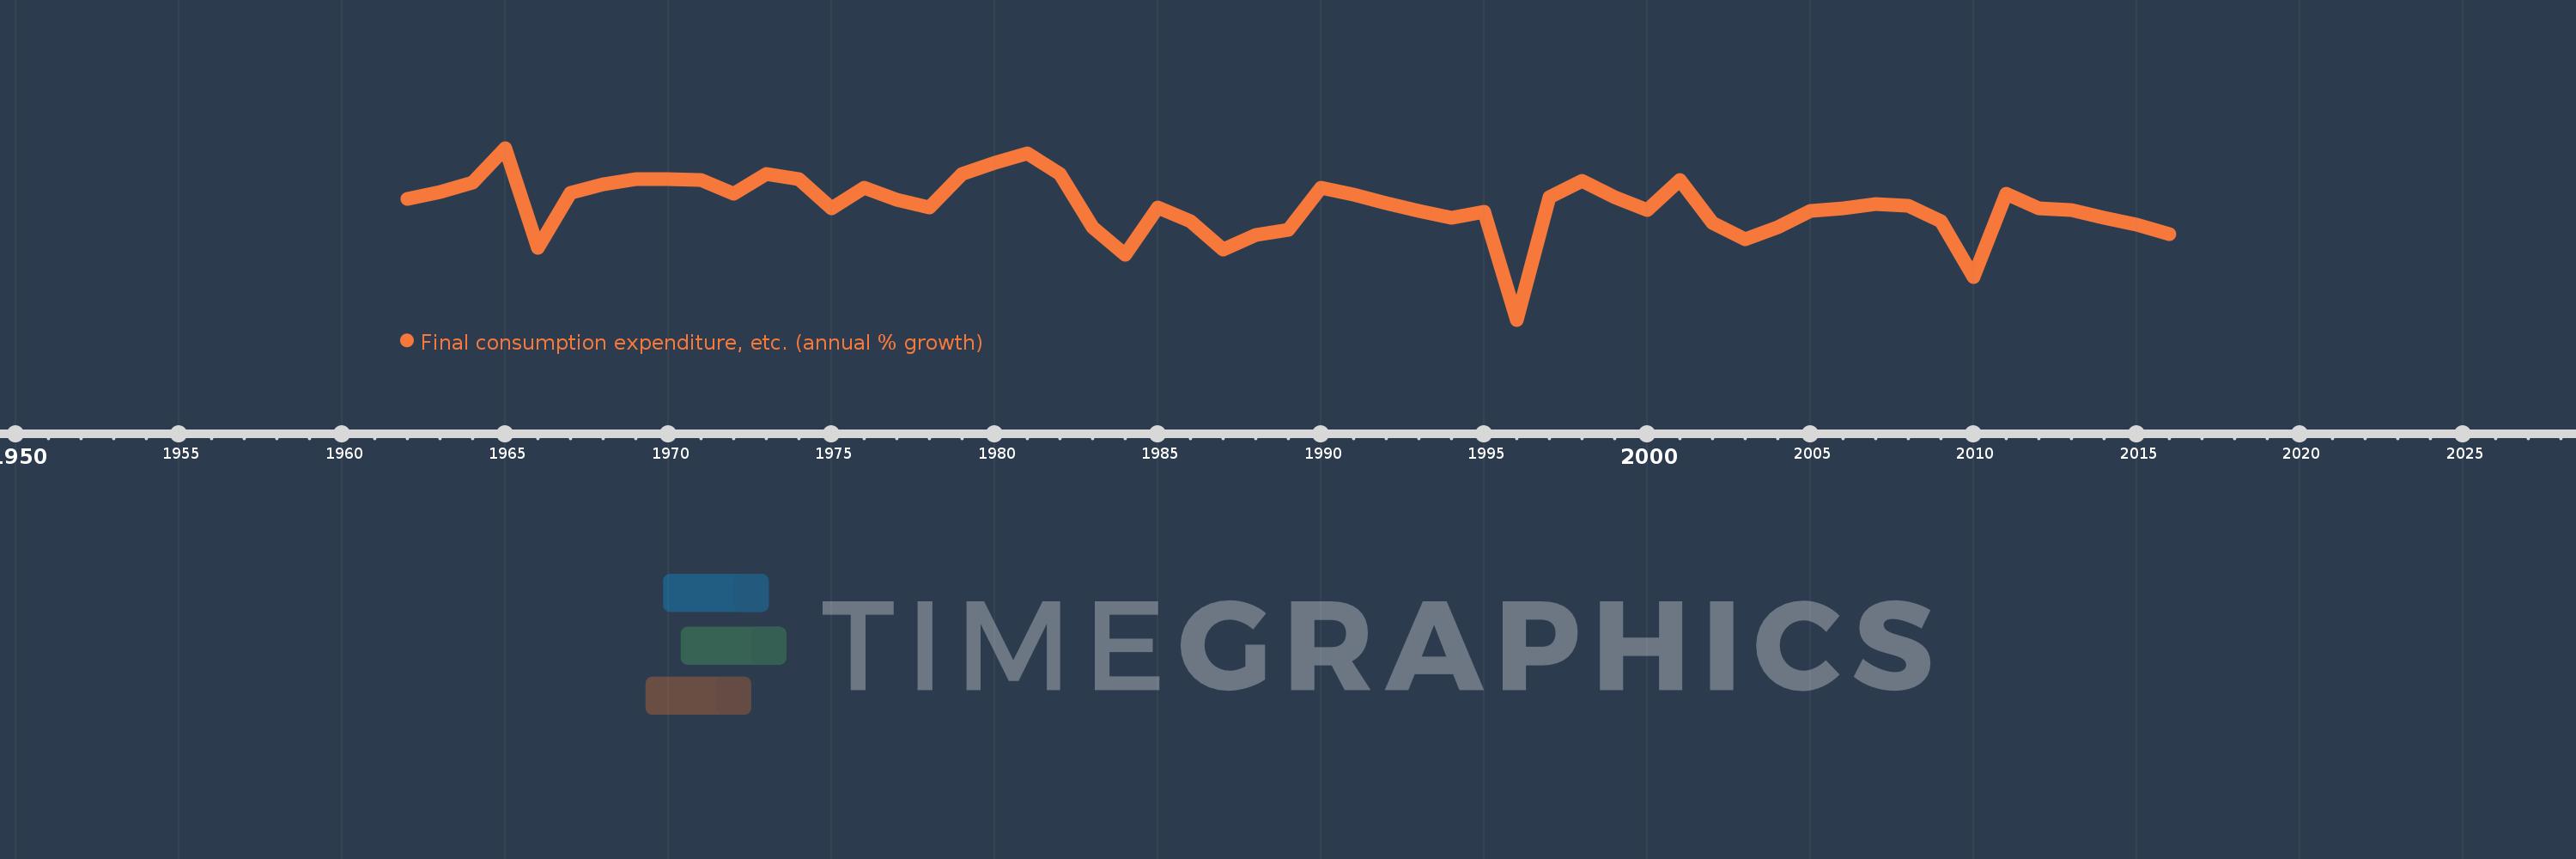
Final consumption expenditure, etc. (annual % growth)
2016,2015,2014,2013,2012,2011,2010,2009,2008,2007,2006,2005,2004,2003,2002,2001,2000,1999,1998,1997,1996,1995,1994,1993,1992,1991,1990,1989,1988,1987,1986,1985,1984,1983,1982,1981,1980,1979,1978,1977,1976,1975,1974,1973,1972,1971,1970,1969,1968,1967,1966,1965,1964,1963,1962
This statistics in other country:
AlbaniaAlgeriaAntigua and BarbudaArab WorldArgentinaArmeniaAustraliaAustriaAzerbaijanBahamas, TheBahrainBangladeshBarbadosBelarusBelgiumBelizeBeninBhutanBoliviaBosnia and HerzegovinaBotswanaBrazilBrunei DarussalamBulgariaBurkina FasoBurundiCabo VerdeCambodiaCameroonCanadaCaribbean small statesCentral Europe and the BalticsChadChileColombiaComorosCongo, Dem. Rep.Congo, Rep.Costa RicaCote d'IvoireCroatiaCubaCyprusCzech RepublicDenmarkDjiboutiDominican RepublicEarly-demographic dividendEast Asia & PacificEcuadorEgypt, Arab Rep.El SalvadorEquatorial GuineaEritreaEstoniaEthiopiaEuro areaEurope & Central AsiaEurope & Central Asia (excluding high income)Europe & Central Asia (IDA & IBRD countries)European UnionFijiFinlandFranceGabonGambia, TheGeorgiaGermanyGhanaGreeceGuatemalaGuineaGuinea-BissauHaitiHeavily indebted poor countries (HIPC)High incomeHondurasHong Kong SAR, ChinaHungaryIBRD onlyIcelandIDA & IBRD totalIDA blendIDA onlyIDA totalIndiaIndonesiaIran, Islamic Rep.IrelandIsraelItalyJamaicaJapanJordanKazakhstanKenyaKorea, Rep.KosovoKuwaitKyrgyz RepublicLao PDRLatin America & Caribbean Latin America & Caribbean (excluding high income)Latin America & the Caribbean (IDA & IBRD countries)LatviaLeast developed countries: UN classificationLebanonLiberiaLithuaniaLow & middle incomeLow incomeLower middle incomeLuxembourgMacao SAR, ChinaMacedonia, FYRMadagascarMalawiMalaysiaMaliMaltaMauritaniaMauritiusMexicoMiddle East & North AfricaMiddle East & North Africa (excluding high income)Middle East & North Africa (IDA & IBRD countries)Middle incomeMoldovaMongoliaMontenegroMoroccoMozambiqueNamibiaNepalNetherlandsNew ZealandNicaraguaNigerNigeriaNorth AmericaNorwayOECD membersOmanOther small statesPakistanPanamaPapua New GuineaParaguayPeruPhilippinesPolandPortugalPost-demographic dividendPre-demographic dividendPuerto RicoQatarRomaniaRussian FederationRwandaSaudi ArabiaSenegalSerbiaSeychellesSierra LeoneSingaporeSlovak RepublicSloveniaSmall statesSomaliaSouth AfricaSouth AsiaSouth Asia (IDA & IBRD)South SudanSpainSri LankaSub-Saharan Africa Sub-Saharan Africa (excluding high income)Sub-Saharan Africa (IDA & IBRD countries)SudanSurinameSwazilandSwedenSwitzerlandSyrian Arab RepublicTajikistanTanzaniaThailandTimor-LesteTogoTrinidad and TobagoTunisiaTurkeyTurkmenistanUgandaUkraineUnited Arab EmiratesUnited KingdomUnited StatesUpper middle incomeUruguayUzbekistanVanuatuVenezuela, RBVietnamWest Bank and GazaWorldZimbabwe Timeline:
This timeline shows a graph from 1962 to 2016 of Mexico. No data until 1961. Number of actual observations by date: 55.
Source name:
World Development Indicators
Source organization:
World Bank national accounts data, and OECD National Accounts data files.
Categories, topics:
Economy & Growth
Last updated:
apr 23, 2017
Indicators value changes by year
Minimum:
-9.407
jan 1, 1996
Maximum:
10.624
jan 1, 1965
At the date of observation
Value
Absolute change
Change from previous value
jan 1, 1962
4.671
+4.671
0.0%
jan 1, 1963
5.488
+0.817
17.48%
jan 1, 1964
6.609
+1.122
20.44%
jan 1, 1965
10.624
+4.014
60.73%
jan 1, 1966
-0.991
-11.614
-109.32%
jan 1, 1967
5.43
+6.421
-648.24%
jan 1, 1968
6.373
+0.943
17.36%
jan 1, 1969
6.975
+0.602
9.45%
jan 1, 1970
6.948
-0.027
-0.39%
jan 1, 1971
6.918
-0.031
-0.44%
jan 1, 1972
5.289
-1.629
-23.54%
jan 1, 1973
7.632
+2.343
44.31%
jan 1, 1974
6.947
-0.685
-8.98%
jan 1, 1975
3.596
-3.351
-48.24%
jan 1, 1976
6.03
+2.434
67.69%
jan 1, 1977
4.618
-1.412
-23.41%
jan 1, 1978
3.672
-0.946
-20.49%
jan 1, 1979
7.596
+3.924
106.88%
jan 1, 1980
8.898
+1.302
17.13%
jan 1, 1981
10.037
+1.139
12.81%
jan 1, 1982
7.548
-2.489
-24.8%
jan 1, 1983
1.412
-6.136
-81.3%
jan 1, 1984
-1.866
-3.278
-232.22%
jan 1, 1985
3.693
+5.559
-297.87%
jan 1, 1986
2.038
-1.655
-44.81%
jan 1, 1987
-1.184
-3.222
-158.12%
jan 1, 1988
0.456
+1.641
-138.53%
jan 1, 1989
1.1
+0.644
141.07%
jan 1, 1990
5.949
+4.848
440.73%
jan 1, 1991
5.229
-0.719
-12.09%
jan 1, 1992
4.153
-1.076
-20.58%
jan 1, 1993
3.289
-0.864
-20.81%
jan 1, 1994
2.508
-0.781
-23.75%
jan 1, 1995
3.167
+0.659
26.27%
jan 1, 1996
-9.407
-12.574
-397.07%
jan 1, 1997
4.913
+14.32
-152.23%
jan 1, 1998
6.811
+1.898
38.63%
jan 1, 1999
4.842
-1.969
-28.91%
jan 1, 2000
3.374
-1.468
-30.31%
jan 1, 2001
6.888
+3.514
104.13%
jan 1, 2002
1.836
-5.052
-73.34%
jan 1, 2003
-0.058
-1.894
-103.15%
jan 1, 2004
1.368
+1.426
-2.46K%
jan 1, 2005
3.251
+1.883
137.67%
jan 1, 2006
3.618
+0.367
11.28%
jan 1, 2007
4.072
+0.454
12.53%
jan 1, 2008
3.901
-0.171
-4.2%
jan 1, 2009
2.115
-1.786
-45.79%
jan 1, 2010
-4.449
-6.563
-310.37%
jan 1, 2011
5.302
+9.751
-219.18%
jan 1, 2012
3.608
-1.694
-31.96%
jan 1, 2013
3.343
-0.265
-7.34%
jan 1, 2014
2.445
-0.898
-26.87%
jan 1, 2015
1.638
-0.807
-33.0%
jan 1, 2016
0.547
-1.091
-66.58%
Ranking of countries by current statistics by years


Comments: