29
/
en
AIzaSyAYiBZKx7MnpbEhh9jyipgxe19OcubqV5w
April 1, 2024
264560
Togo
TGO
true
2
1
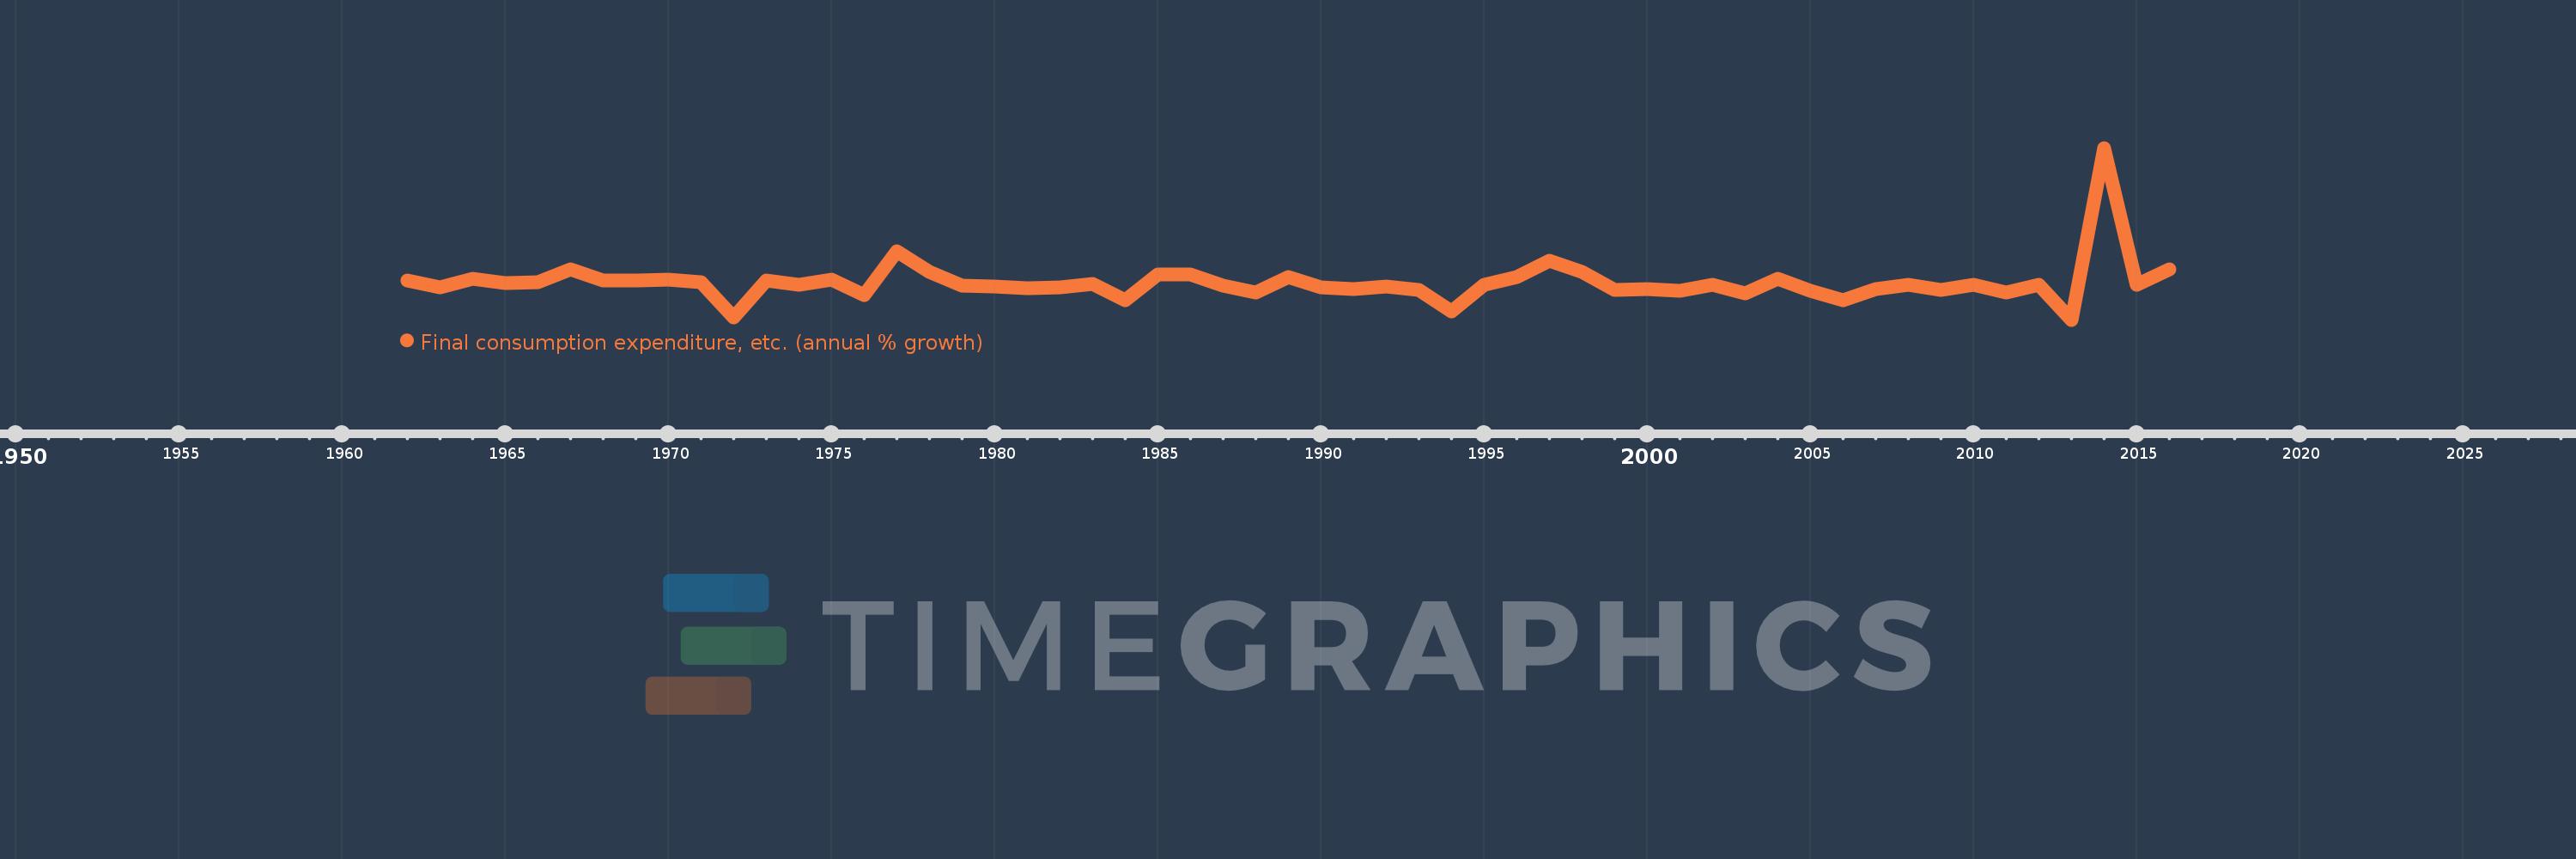
Final consumption expenditure, etc. (annual % growth)
2016,2015,2014,2013,2012,2011,2010,2009,2008,2007,2006,2005,2004,2003,2002,2001,2000,1999,1998,1997,1996,1995,1994,1993,1992,1991,1990,1989,1988,1987,1986,1985,1984,1983,1982,1981,1980,1979,1978,1977,1976,1975,1974,1973,1972,1971,1970,1969,1968,1967,1966,1965,1964,1963,1962
This statistics in other country:
AlbaniaAlgeriaAntigua and BarbudaArab WorldArgentinaArmeniaAustraliaAustriaAzerbaijanBahamas, TheBahrainBangladeshBarbadosBelarusBelgiumBelizeBeninBhutanBoliviaBosnia and HerzegovinaBotswanaBrazilBrunei DarussalamBulgariaBurkina FasoBurundiCabo VerdeCambodiaCameroonCanadaCaribbean small statesCentral Europe and the BalticsChadChileColombiaComorosCongo, Dem. Rep.Congo, Rep.Costa RicaCote d'IvoireCroatiaCubaCyprusCzech RepublicDenmarkDjiboutiDominican RepublicEarly-demographic dividendEast Asia & PacificEcuadorEgypt, Arab Rep.El SalvadorEquatorial GuineaEritreaEstoniaEthiopiaEuro areaEurope & Central AsiaEurope & Central Asia (excluding high income)Europe & Central Asia (IDA & IBRD countries)European UnionFijiFinlandFranceGabonGambia, TheGeorgiaGermanyGhanaGreeceGuatemalaGuineaGuinea-BissauHaitiHeavily indebted poor countries (HIPC)High incomeHondurasHong Kong SAR, ChinaHungaryIBRD onlyIcelandIDA & IBRD totalIDA blendIDA onlyIDA totalIndiaIndonesiaIran, Islamic Rep.IrelandIsraelItalyJamaicaJapanJordanKazakhstanKenyaKorea, Rep.KosovoKuwaitKyrgyz RepublicLao PDRLatin America & Caribbean Latin America & Caribbean (excluding high income)Latin America & the Caribbean (IDA & IBRD countries)LatviaLeast developed countries: UN classificationLebanonLiberiaLithuaniaLow & middle incomeLow incomeLower middle incomeLuxembourgMacao SAR, ChinaMacedonia, FYRMadagascarMalawiMalaysiaMaliMaltaMauritaniaMauritiusMexicoMiddle East & North AfricaMiddle East & North Africa (excluding high income)Middle East & North Africa (IDA & IBRD countries)Middle incomeMoldovaMongoliaMontenegroMoroccoMozambiqueNamibiaNepalNetherlandsNew ZealandNicaraguaNigerNigeriaNorth AmericaNorwayOECD membersOmanOther small statesPakistanPanamaPapua New GuineaParaguayPeruPhilippinesPolandPortugalPost-demographic dividendPre-demographic dividendPuerto RicoQatarRomaniaRussian FederationRwandaSaudi ArabiaSenegalSerbiaSeychellesSierra LeoneSingaporeSlovak RepublicSloveniaSmall statesSomaliaSouth AfricaSouth AsiaSouth Asia (IDA & IBRD)South SudanSpainSri LankaSub-Saharan Africa Sub-Saharan Africa (excluding high income)Sub-Saharan Africa (IDA & IBRD countries)SudanSurinameSwazilandSwedenSwitzerlandSyrian Arab RepublicTajikistanTanzaniaThailandTimor-LesteTogoTrinidad and TobagoTunisiaTurkeyTurkmenistanUgandaUkraineUnited Arab EmiratesUnited KingdomUnited StatesUpper middle incomeUruguayUzbekistanVanuatuVenezuela, RBVietnamWest Bank and GazaWorldZimbabwe Timeline:
This timeline shows a graph from 1962 to 2016 of Togo. No data until 1961. Number of actual observations by date: 55.
Source name:
World Development Indicators
Source organization:
World Bank national accounts data, and OECD National Accounts data files.
Categories, topics:
Economy & Growth
Last updated:
apr 23, 2017
Indicators value changes by year
Minimum:
-28.346
jan 1, 2013
Maximum:
127.148
jan 1, 2014
At the date of observation
Value
Absolute change
Change from previous value
jan 1, 1962
7.153
+7.153
0.0%
jan 1, 1963
0.952
-6.2
-86.69%
jan 1, 1964
8.667
+7.715
810.02%
jan 1, 1965
4.628
-4.038
-46.6%
jan 1, 1966
5.716
+1.087
23.49%
jan 1, 1967
17.364
+11.648
203.79%
jan 1, 1968
7.289
-10.075
-58.02%
jan 1, 1969
7.121
-0.168
-2.31%
jan 1, 1970
8.252
+1.132
15.89%
jan 1, 1971
5.503
-2.75
-33.32%
jan 1, 1972
-25.986
-31.489
-572.21%
jan 1, 1973
7.253
+33.239
-127.91%
jan 1, 1974
3.547
-3.706
-51.1%
jan 1, 1975
8.27
+4.723
133.15%
jan 1, 1976
-6.051
-14.32
-173.16%
jan 1, 1977
33.604
+39.655
-655.39%
jan 1, 1978
15.052
-18.552
-55.21%
jan 1, 1979
2.384
-12.668
-84.16%
jan 1, 1980
1.891
-0.494
-20.71%
jan 1, 1981
0.489
-1.402
-74.13%
jan 1, 1982
0.788
+0.298
61.02%
jan 1, 1983
4.079
+3.292
417.97%
jan 1, 1984
-10.998
-15.077
-369.59%
jan 1, 1985
12.478
+23.476
-213.46%
jan 1, 1986
12.351
-0.127
-1.02%
jan 1, 1987
2.327
-10.024
-81.16%
jan 1, 1988
-4.023
-6.35
-272.85%
jan 1, 1989
10.454
+14.477
-359.87%
jan 1, 1990
1.18
-9.274
-88.71%
jan 1, 1991
-0.727
-1.907
-161.58%
jan 1, 1992
1.756
+2.483
-341.57%
jan 1, 1993
-1.148
-2.904
-165.4%
jan 1, 1994
-21.018
-19.869
1.73K%
jan 1, 1995
3.104
+24.122
-114.77%
jan 1, 1996
10.555
+7.451
240.0%
jan 1, 1997
25.252
+14.697
139.24%
jan 1, 1998
15.297
-9.955
-39.42%
jan 1, 1999
-1.286
-16.583
-108.41%
jan 1, 2000
-0.738
+0.548
-42.63%
jan 1, 2001
-2.288
-1.55
210.15%
jan 1, 2002
3.203
+5.492
-240.0%
jan 1, 2003
-4.219
-7.422
-231.7%
jan 1, 2004
8.481
+12.699
-301.02%
jan 1, 2005
-2.028
-10.508
-123.91%
jan 1, 2006
-10.614
-8.586
423.42%
jan 1, 2007
-0.832
+9.782
-92.16%
jan 1, 2008
3.273
+4.105
-493.27%
jan 1, 2009
-1.148
-4.421
-135.08%
jan 1, 2010
2.965
+4.113
-358.2%
jan 1, 2011
-3.736
-6.701
-226.02%
jan 1, 2012
3.287
+7.023
-187.97%
jan 1, 2013
-28.346
-31.633
-962.38%
jan 1, 2014
127.148
+155.493
-548.56%
jan 1, 2015
2.955
-124.192
-97.68%
jan 1, 2016
16.987
+14.032
474.81%
Ranking of countries by current statistics by years


Comments: