29
/
en
AIzaSyAYiBZKx7MnpbEhh9jyipgxe19OcubqV5w
April 1, 2024
124759
Egypt, Arab Rep.
EGY
true
2
1
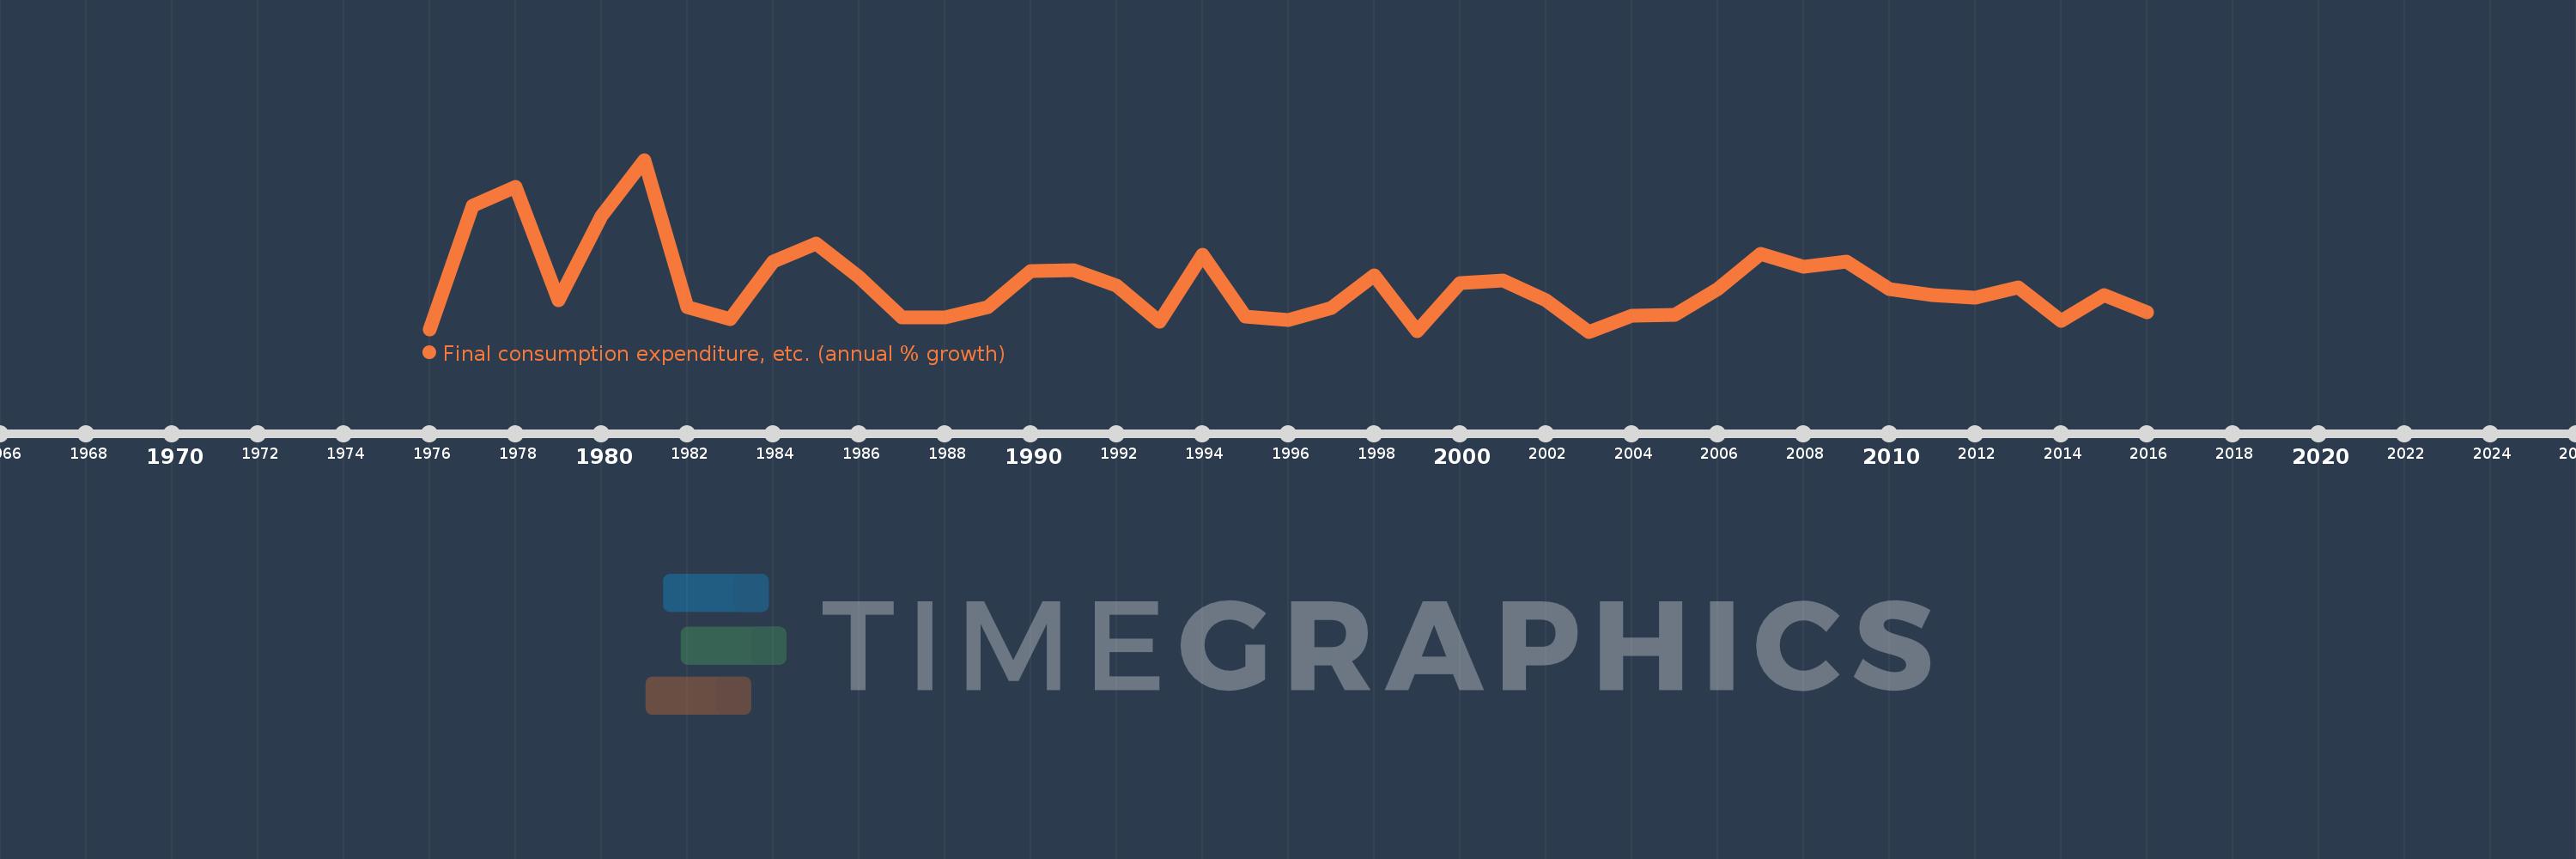
Final consumption expenditure, etc. (annual % growth)
2016,2015,2014,2013,2012,2011,2010,2009,2008,2007,2006,2005,2004,2003,2002,2001,2000,1999,1998,1997,1996,1995,1994,1993,1992,1991,1990,1989,1988,1987,1986,1985,1984,1983,1982,1981,1980,1979,1978,1977,1976
This statistics in other country:
AlbaniaAlgeriaAntigua and BarbudaArab WorldArgentinaArmeniaAustraliaAustriaAzerbaijanBahamas, TheBahrainBangladeshBarbadosBelarusBelgiumBelizeBeninBhutanBoliviaBosnia and HerzegovinaBotswanaBrazilBrunei DarussalamBulgariaBurkina FasoBurundiCabo VerdeCambodiaCameroonCanadaCaribbean small statesCentral Europe and the BalticsChadChileColombiaComorosCongo, Dem. Rep.Congo, Rep.Costa RicaCote d'IvoireCroatiaCubaCyprusCzech RepublicDenmarkDjiboutiDominican RepublicEarly-demographic dividendEast Asia & PacificEcuadorEgypt, Arab Rep.El SalvadorEquatorial GuineaEritreaEstoniaEthiopiaEuro areaEurope & Central AsiaEurope & Central Asia (excluding high income)Europe & Central Asia (IDA & IBRD countries)European UnionFijiFinlandFranceGabonGambia, TheGeorgiaGermanyGhanaGreeceGuatemalaGuineaGuinea-BissauHaitiHeavily indebted poor countries (HIPC)High incomeHondurasHong Kong SAR, ChinaHungaryIBRD onlyIcelandIDA & IBRD totalIDA blendIDA onlyIDA totalIndiaIndonesiaIran, Islamic Rep.IrelandIsraelItalyJamaicaJapanJordanKazakhstanKenyaKorea, Rep.KosovoKuwaitKyrgyz RepublicLao PDRLatin America & Caribbean Latin America & Caribbean (excluding high income)Latin America & the Caribbean (IDA & IBRD countries)LatviaLeast developed countries: UN classificationLebanonLiberiaLithuaniaLow & middle incomeLow incomeLower middle incomeLuxembourgMacao SAR, ChinaMacedonia, FYRMadagascarMalawiMalaysiaMaliMaltaMauritaniaMauritiusMexicoMiddle East & North AfricaMiddle East & North Africa (excluding high income)Middle East & North Africa (IDA & IBRD countries)Middle incomeMoldovaMongoliaMontenegroMoroccoMozambiqueNamibiaNepalNetherlandsNew ZealandNicaraguaNigerNigeriaNorth AmericaNorwayOECD membersOmanOther small statesPakistanPanamaPapua New GuineaParaguayPeruPhilippinesPolandPortugalPost-demographic dividendPre-demographic dividendPuerto RicoQatarRomaniaRussian FederationRwandaSaudi ArabiaSenegalSerbiaSeychellesSierra LeoneSingaporeSlovak RepublicSloveniaSmall statesSomaliaSouth AfricaSouth AsiaSouth Asia (IDA & IBRD)South SudanSpainSri LankaSub-Saharan Africa Sub-Saharan Africa (excluding high income)Sub-Saharan Africa (IDA & IBRD countries)SudanSurinameSwazilandSwedenSwitzerlandSyrian Arab RepublicTajikistanTanzaniaThailandTimor-LesteTogoTrinidad and TobagoTunisiaTurkeyTurkmenistanUgandaUkraineUnited Arab EmiratesUnited KingdomUnited StatesUpper middle incomeUruguayUzbekistanVanuatuVenezuela, RBVietnamWest Bank and GazaWorldZimbabwe Timeline:
This timeline shows a graph from 1976 to 2016 of Egypt, Arab Rep.. No data until 1975. Number of actual observations by date: 41.
Source name:
World Development Indicators
Source organization:
World Bank national accounts data, and OECD National Accounts data files.
Categories, topics:
Economy & Growth
Last updated:
apr 23, 2017
Indicators value changes by year
Maximum:
12.134
jan 1, 1981
At the date of observation
Value
Absolute change
Change from previous value
jan 1, 1976
2.414
+2.414
0.0%
jan 1, 1977
9.496
+7.082
293.32%
jan 1, 1978
10.597
+1.101
11.59%
jan 1, 1979
4.085
-6.512
-61.45%
jan 1, 1980
8.896
+4.81
117.75%
jan 1, 1981
12.134
+3.238
36.4%
jan 1, 1982
3.676
-8.458
-69.7%
jan 1, 1983
3.032
-0.644
-17.51%
jan 1, 1984
6.317
+3.284
108.31%
jan 1, 1985
7.315
+0.998
15.8%
jan 1, 1986
5.427
-1.888
-25.81%
jan 1, 1987
3.107
-2.32
-42.76%
jan 1, 1988
3.101
-0.006
-0.18%
jan 1, 1989
3.688
+0.587
18.94%
jan 1, 1990
5.78
+2.092
56.71%
jan 1, 1991
5.802
+0.022
0.38%
jan 1, 1992
4.926
-0.876
-15.1%
jan 1, 1993
2.873
-2.053
-41.67%
jan 1, 1994
6.705
+3.831
133.33%
jan 1, 1995
3.139
-3.566
-53.18%
jan 1, 1996
2.974
-0.165
-5.27%
jan 1, 1997
3.627
+0.653
21.96%
jan 1, 1998
5.533
+1.906
52.55%
jan 1, 1999
2.316
-3.217
-58.15%
jan 1, 2000
5.077
+2.761
119.23%
jan 1, 2001
5.226
+0.149
2.94%
jan 1, 2002
4.094
-1.132
-21.67%
jan 1, 2003
2.296
-1.797
-43.91%
jan 1, 2004
3.194
+0.898
39.09%
jan 1, 2005
3.262
+0.068
2.14%
jan 1, 2006
4.716
+1.454
44.56%
jan 1, 2007
6.735
+2.019
42.82%
jan 1, 2008
6.028
-0.707
-10.5%
jan 1, 2009
6.307
+0.28
4.64%
jan 1, 2010
4.72
-1.587
-25.17%
jan 1, 2011
4.386
-0.334
-7.08%
jan 1, 2012
4.221
-0.165
-3.75%
jan 1, 2013
4.821
+0.6
14.22%
jan 1, 2014
2.906
-1.915
-39.72%
jan 1, 2015
4.383
+1.477
50.82%
jan 1, 2016
3.381
-1.003
-22.88%
Ranking of countries by current statistics by years


Comments: