29
/
en
AIzaSyAYiBZKx7MnpbEhh9jyipgxe19OcubqV5w
April 1, 2024
30646
Europe & Central Asia
ECS
false
2
1
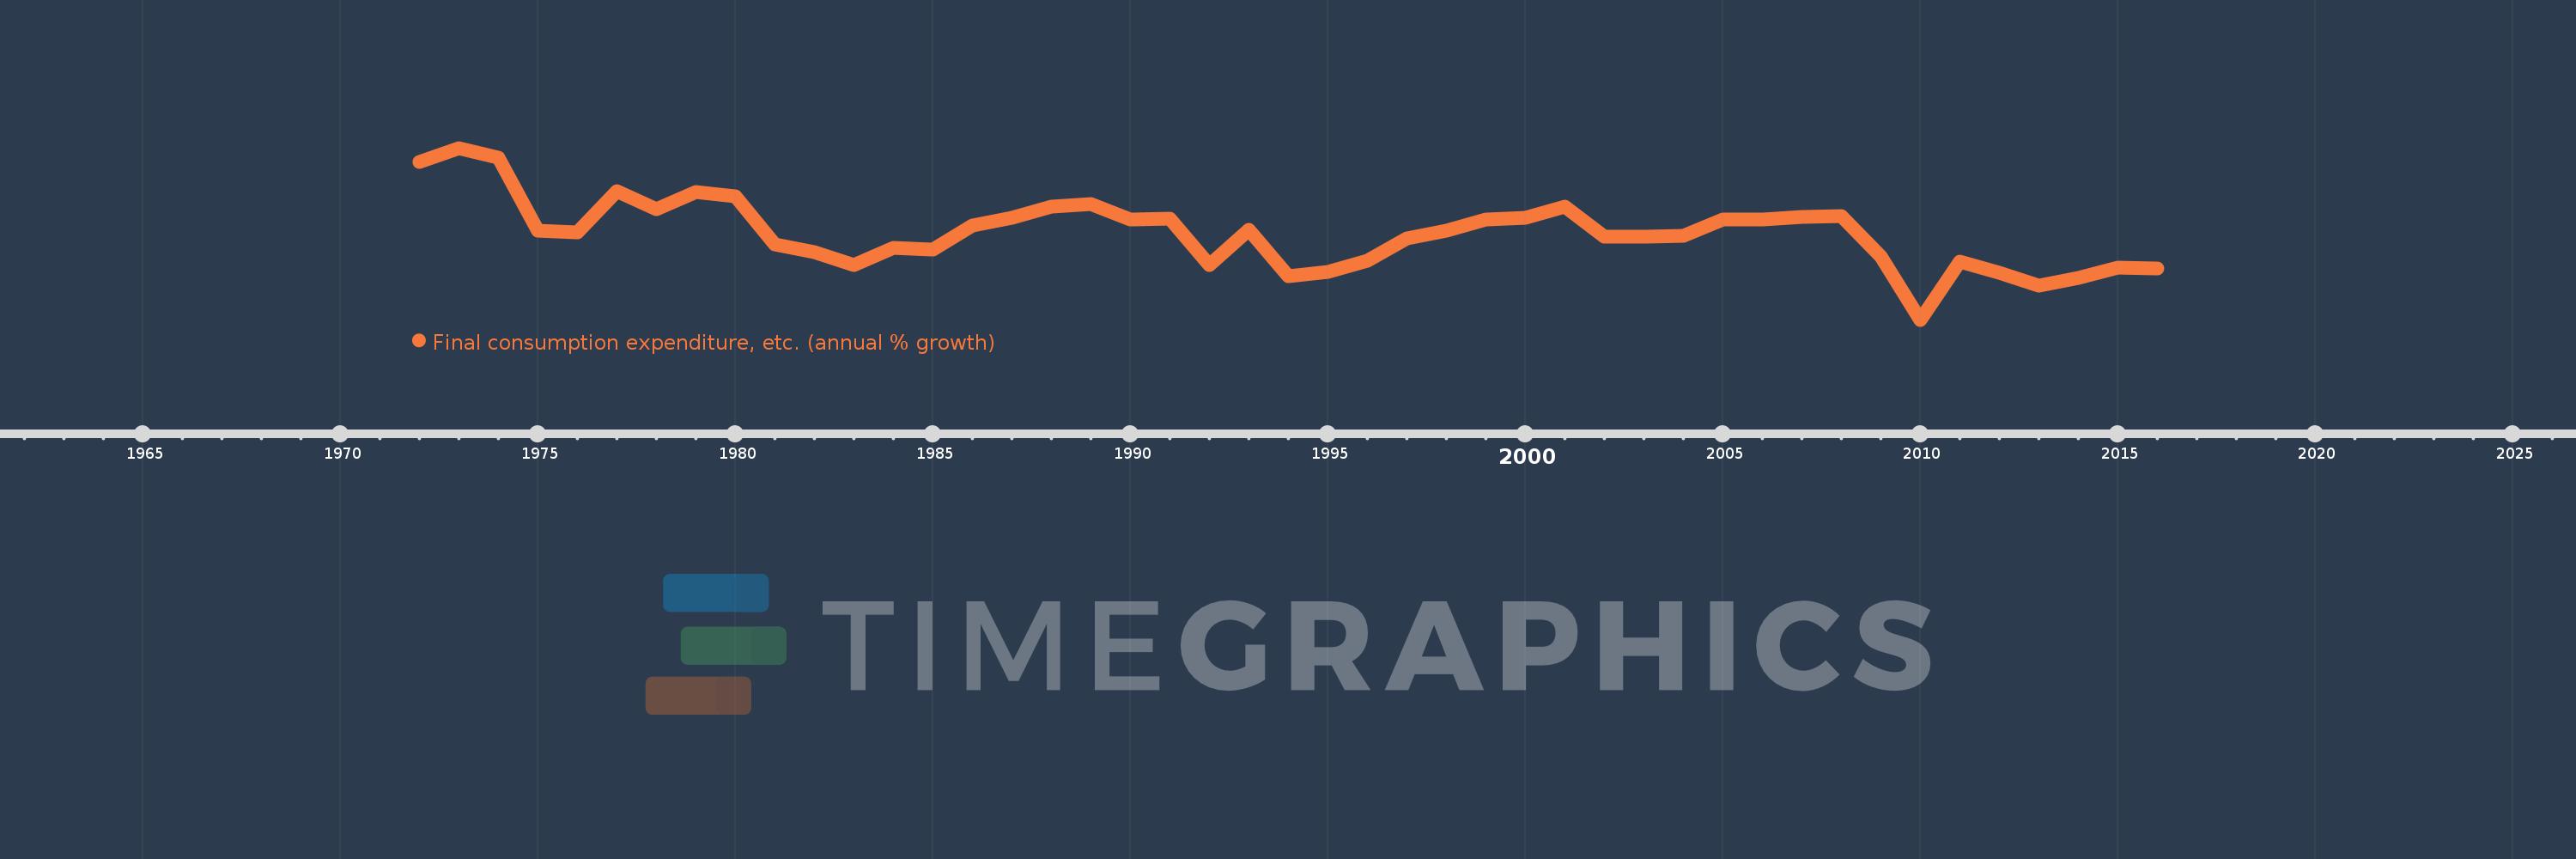
Final consumption expenditure, etc. (annual % growth)
2016,2015,2014,2013,2012,2011,2010,2009,2008,2007,2006,2005,2004,2003,2002,2001,2000,1999,1998,1997,1996,1995,1994,1993,1992,1991,1990,1989,1988,1987,1986,1985,1984,1983,1982,1981,1980,1979,1978,1977,1976,1975,1974,1973,1972
This statistics in other country:
AlbaniaAlgeriaAntigua and BarbudaArab WorldArgentinaArmeniaAustraliaAustriaAzerbaijanBahamas, TheBahrainBangladeshBarbadosBelarusBelgiumBelizeBeninBhutanBoliviaBosnia and HerzegovinaBotswanaBrazilBrunei DarussalamBulgariaBurkina FasoBurundiCabo VerdeCambodiaCameroonCanadaCaribbean small statesCentral Europe and the BalticsChadChileColombiaComorosCongo, Dem. Rep.Congo, Rep.Costa RicaCote d'IvoireCroatiaCubaCyprusCzech RepublicDenmarkDjiboutiDominican RepublicEarly-demographic dividendEast Asia & PacificEcuadorEgypt, Arab Rep.El SalvadorEquatorial GuineaEritreaEstoniaEthiopiaEuro areaEurope & Central AsiaEurope & Central Asia (excluding high income)Europe & Central Asia (IDA & IBRD countries)European UnionFijiFinlandFranceGabonGambia, TheGeorgiaGermanyGhanaGreeceGuatemalaGuineaGuinea-BissauHaitiHeavily indebted poor countries (HIPC)High incomeHondurasHong Kong SAR, ChinaHungaryIBRD onlyIcelandIDA & IBRD totalIDA blendIDA onlyIDA totalIndiaIndonesiaIran, Islamic Rep.IrelandIsraelItalyJamaicaJapanJordanKazakhstanKenyaKorea, Rep.KosovoKuwaitKyrgyz RepublicLao PDRLatin America & Caribbean Latin America & Caribbean (excluding high income)Latin America & the Caribbean (IDA & IBRD countries)LatviaLeast developed countries: UN classificationLebanonLiberiaLithuaniaLow & middle incomeLow incomeLower middle incomeLuxembourgMacao SAR, ChinaMacedonia, FYRMadagascarMalawiMalaysiaMaliMaltaMauritaniaMauritiusMexicoMiddle East & North AfricaMiddle East & North Africa (excluding high income)Middle East & North Africa (IDA & IBRD countries)Middle incomeMoldovaMongoliaMontenegroMoroccoMozambiqueNamibiaNepalNetherlandsNew ZealandNicaraguaNigerNigeriaNorth AmericaNorwayOECD membersOmanOther small statesPakistanPanamaPapua New GuineaParaguayPeruPhilippinesPolandPortugalPost-demographic dividendPre-demographic dividendPuerto RicoQatarRomaniaRussian FederationRwandaSaudi ArabiaSenegalSerbiaSeychellesSierra LeoneSingaporeSlovak RepublicSloveniaSmall statesSomaliaSouth AfricaSouth AsiaSouth Asia (IDA & IBRD)South SudanSpainSri LankaSub-Saharan Africa Sub-Saharan Africa (excluding high income)Sub-Saharan Africa (IDA & IBRD countries)SudanSurinameSwazilandSwedenSwitzerlandSyrian Arab RepublicTajikistanTanzaniaThailandTimor-LesteTogoTrinidad and TobagoTunisiaTurkeyTurkmenistanUgandaUkraineUnited Arab EmiratesUnited KingdomUnited StatesUpper middle incomeUruguayUzbekistanVanuatuVenezuela, RBVietnamWest Bank and GazaWorldZimbabwe Timeline:
This timeline shows a graph from 1972 to 2016 of Europe & Central Asia. No data until 1971. Number of actual observations by date: 45.
Source name:
World Development Indicators
Source organization:
World Bank national accounts data, and OECD National Accounts data files.
Categories, topics:
Economy & Growth
Last updated:
apr 23, 2017
Indicators value changes by year
Minimum:
-0.781
jan 1, 2010
At the date of observation
Value
Absolute change
Change from previous value
jan 1, 1972
4.845
+4.845
0.0%
jan 1, 1973
5.354
+0.509
10.51%
jan 1, 1974
5.002
-0.352
-6.58%
jan 1, 1975
2.398
-2.604
-52.07%
jan 1, 1976
2.337
-0.06
-2.52%
jan 1, 1977
3.806
+1.469
62.85%
jan 1, 1978
3.166
-0.64
-16.81%
jan 1, 1979
3.793
+0.627
19.79%
jan 1, 1980
3.632
-0.161
-4.25%
jan 1, 1981
1.902
-1.729
-47.62%
jan 1, 1982
1.648
-0.254
-13.36%
jan 1, 1983
1.184
-0.465
-28.19%
jan 1, 1984
1.778
+0.594
50.17%
jan 1, 1985
1.73
-0.048
-2.68%
jan 1, 1986
2.582
+0.852
49.28%
jan 1, 1987
2.875
+0.293
11.33%
jan 1, 1988
3.254
+0.379
13.17%
jan 1, 1989
3.345
+0.091
2.8%
jan 1, 1990
2.799
-0.546
-16.33%
jan 1, 1991
2.842
+0.044
1.57%
jan 1, 1992
1.158
-1.684
-59.26%
jan 1, 1993
2.428
+1.27
109.65%
jan 1, 1994
0.784
-1.643
-67.69%
jan 1, 1995
0.92
+0.135
17.26%
jan 1, 1996
1.338
+0.419
45.5%
jan 1, 1997
2.138
+0.8
59.76%
jan 1, 1998
2.398
+0.259
12.12%
jan 1, 1999
2.793
+0.395
16.49%
jan 1, 2000
2.858
+0.065
2.33%
jan 1, 2001
3.274
+0.416
14.57%
jan 1, 2002
2.19
-1.084
-33.11%
jan 1, 2003
2.187
-0.003
-0.13%
jan 1, 2004
2.221
+0.034
1.53%
jan 1, 2005
2.793
+0.572
25.75%
jan 1, 2006
2.793
+0.0
0.01%
jan 1, 2007
2.89
+0.097
3.49%
jan 1, 2008
2.932
+0.041
1.43%
jan 1, 2009
1.492
-1.44
-49.12%
jan 1, 2010
-0.781
-2.272
-152.33%
jan 1, 2011
1.286
+2.067
-264.74%
jan 1, 2012
0.883
-0.403
-31.31%
jan 1, 2013
0.442
-0.441
-49.94%
jan 1, 2014
0.712
+0.269
60.9%
jan 1, 2015
1.087
+0.376
52.81%
jan 1, 2016
1.062
-0.025
-2.32%
Ranking of countries by current statistics by years


Comments: