29
/
en
AIzaSyAYiBZKx7MnpbEhh9jyipgxe19OcubqV5w
April 1, 2024
89760
Botswana
BWA
true
2
1
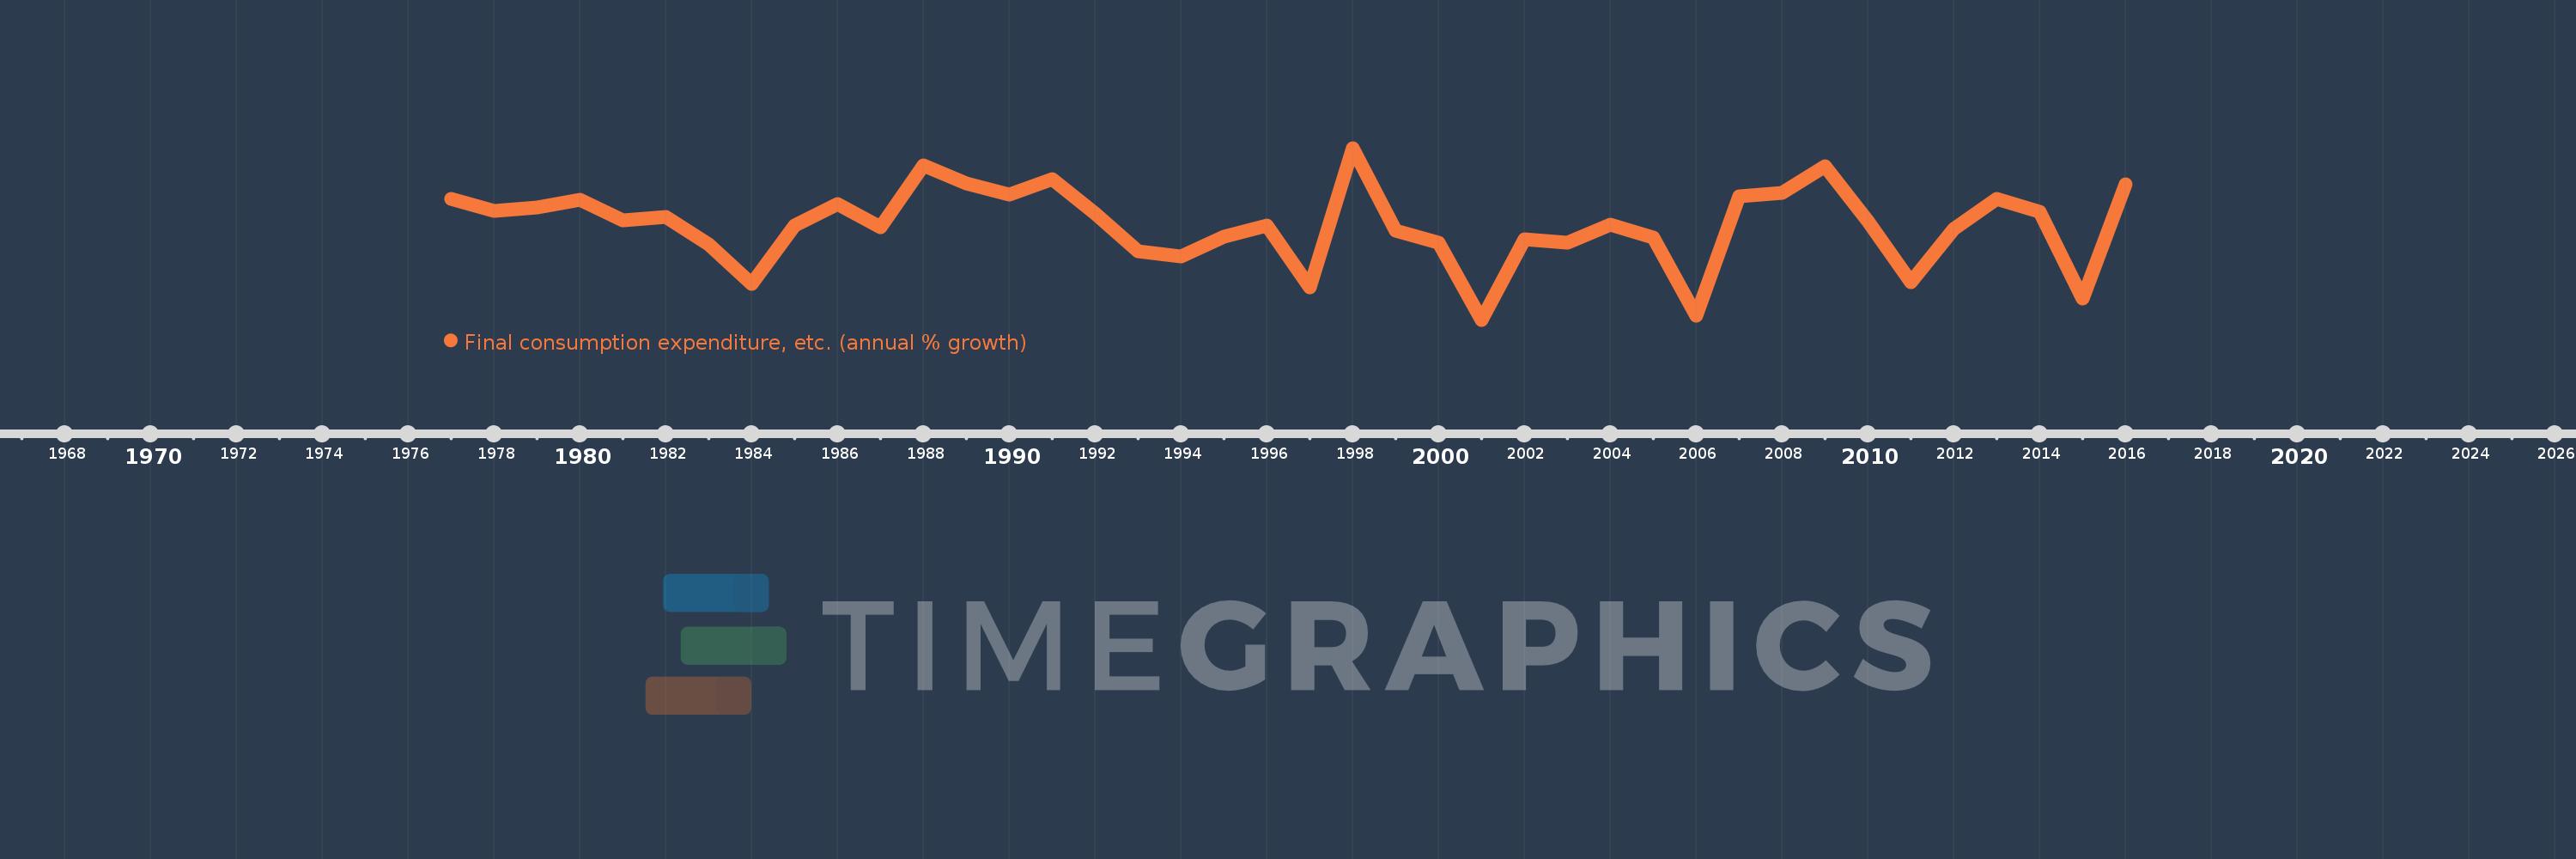
Final consumption expenditure, etc. (annual % growth)
2016,2015,2014,2013,2012,2011,2010,2009,2008,2007,2006,2005,2004,2003,2002,2001,2000,1999,1998,1997,1996,1995,1994,1993,1992,1991,1990,1989,1988,1987,1986,1985,1984,1983,1982,1981,1980,1979,1978,1977
This statistics in other country:
AlbaniaAlgeriaAntigua and BarbudaArab WorldArgentinaArmeniaAustraliaAustriaAzerbaijanBahamas, TheBahrainBangladeshBarbadosBelarusBelgiumBelizeBeninBhutanBoliviaBosnia and HerzegovinaBotswanaBrazilBrunei DarussalamBulgariaBurkina FasoBurundiCabo VerdeCambodiaCameroonCanadaCaribbean small statesCentral Europe and the BalticsChadChileColombiaComorosCongo, Dem. Rep.Congo, Rep.Costa RicaCote d'IvoireCroatiaCubaCyprusCzech RepublicDenmarkDjiboutiDominican RepublicEarly-demographic dividendEast Asia & PacificEcuadorEgypt, Arab Rep.El SalvadorEquatorial GuineaEritreaEstoniaEthiopiaEuro areaEurope & Central AsiaEurope & Central Asia (excluding high income)Europe & Central Asia (IDA & IBRD countries)European UnionFijiFinlandFranceGabonGambia, TheGeorgiaGermanyGhanaGreeceGuatemalaGuineaGuinea-BissauHaitiHeavily indebted poor countries (HIPC)High incomeHondurasHong Kong SAR, ChinaHungaryIBRD onlyIcelandIDA & IBRD totalIDA blendIDA onlyIDA totalIndiaIndonesiaIran, Islamic Rep.IrelandIsraelItalyJamaicaJapanJordanKazakhstanKenyaKorea, Rep.KosovoKuwaitKyrgyz RepublicLao PDRLatin America & Caribbean Latin America & Caribbean (excluding high income)Latin America & the Caribbean (IDA & IBRD countries)LatviaLeast developed countries: UN classificationLebanonLiberiaLithuaniaLow & middle incomeLow incomeLower middle incomeLuxembourgMacao SAR, ChinaMacedonia, FYRMadagascarMalawiMalaysiaMaliMaltaMauritaniaMauritiusMexicoMiddle East & North AfricaMiddle East & North Africa (excluding high income)Middle East & North Africa (IDA & IBRD countries)Middle incomeMoldovaMongoliaMontenegroMoroccoMozambiqueNamibiaNepalNetherlandsNew ZealandNicaraguaNigerNigeriaNorth AmericaNorwayOECD membersOmanOther small statesPakistanPanamaPapua New GuineaParaguayPeruPhilippinesPolandPortugalPost-demographic dividendPre-demographic dividendPuerto RicoQatarRomaniaRussian FederationRwandaSaudi ArabiaSenegalSerbiaSeychellesSierra LeoneSingaporeSlovak RepublicSloveniaSmall statesSomaliaSouth AfricaSouth AsiaSouth Asia (IDA & IBRD)South SudanSpainSri LankaSub-Saharan Africa Sub-Saharan Africa (excluding high income)Sub-Saharan Africa (IDA & IBRD countries)SudanSurinameSwazilandSwedenSwitzerlandSyrian Arab RepublicTajikistanTanzaniaThailandTimor-LesteTogoTrinidad and TobagoTunisiaTurkeyTurkmenistanUgandaUkraineUnited Arab EmiratesUnited KingdomUnited StatesUpper middle incomeUruguayUzbekistanVanuatuVenezuela, RBVietnamWest Bank and GazaWorldZimbabwe Timeline:
This timeline shows a graph from 1977 to 2016 of Botswana. No data until 1976. Number of actual observations by date: 40.
Source name:
World Development Indicators
Source organization:
World Bank national accounts data, and OECD National Accounts data files.
Categories, topics:
Economy & Growth
Last updated:
apr 23, 2017
Indicators value changes by year
Minimum:
-10.646
jan 1, 2001
Maximum:
21.756
jan 1, 1998
At the date of observation
Value
Absolute change
Change from previous value
jan 1, 1977
12.164
+12.164
0.0%
jan 1, 1978
9.803
-2.36
-19.4%
jan 1, 1979
10.543
+0.739
7.54%
jan 1, 1980
11.989
+1.447
13.72%
jan 1, 1981
8.06
-3.929
-32.77%
jan 1, 1982
8.727
+0.667
8.28%
jan 1, 1983
3.622
-5.105
-58.5%
jan 1, 1984
-3.88
-7.502
-207.14%
jan 1, 1985
7.163
+11.043
-284.6%
jan 1, 1986
11.25
+4.087
57.06%
jan 1, 1987
6.728
-4.522
-40.19%
jan 1, 1988
18.414
+11.686
173.68%
jan 1, 1989
15.021
-3.393
-18.42%
jan 1, 1990
12.954
-2.067
-13.76%
jan 1, 1991
15.871
+2.917
22.52%
jan 1, 1992
9.468
-6.403
-40.34%
jan 1, 1993
2.22
-7.248
-76.55%
jan 1, 1994
1.309
-0.911
-41.02%
jan 1, 1995
5.063
+3.753
286.62%
jan 1, 1996
7.105
+2.043
40.35%
jan 1, 1997
-4.512
-11.617
-163.5%
jan 1, 1998
21.756
+26.268
-582.19%
jan 1, 1999
6.188
-15.568
-71.56%
jan 1, 2000
3.838
-2.349
-37.97%
jan 1, 2001
-10.646
-14.484
-377.36%
jan 1, 2002
4.583
+15.229
-143.05%
jan 1, 2003
3.806
-0.777
-16.96%
jan 1, 2004
7.326
+3.52
92.5%
jan 1, 2005
4.883
-2.443
-33.34%
jan 1, 2006
-9.821
-14.704
-301.12%
jan 1, 2007
12.609
+22.431
-228.39%
jan 1, 2008
13.323
+0.714
5.66%
jan 1, 2009
18.313
+4.99
37.46%
jan 1, 2010
7.891
-10.422
-56.91%
jan 1, 2011
-3.588
-11.479
-145.47%
jan 1, 2012
6.542
+10.13
-282.33%
jan 1, 2013
12.149
+5.607
85.71%
jan 1, 2014
9.718
-2.431
-20.01%
jan 1, 2015
-6.705
-16.423
-169.0%
jan 1, 2016
14.964
+21.668
-323.17%
Ranking of countries by current statistics by years


Comments: