29
/
en
AIzaSyAYiBZKx7MnpbEhh9jyipgxe19OcubqV5w
April 1, 2024
110893
Congo, Rep.
COG
true
2
1
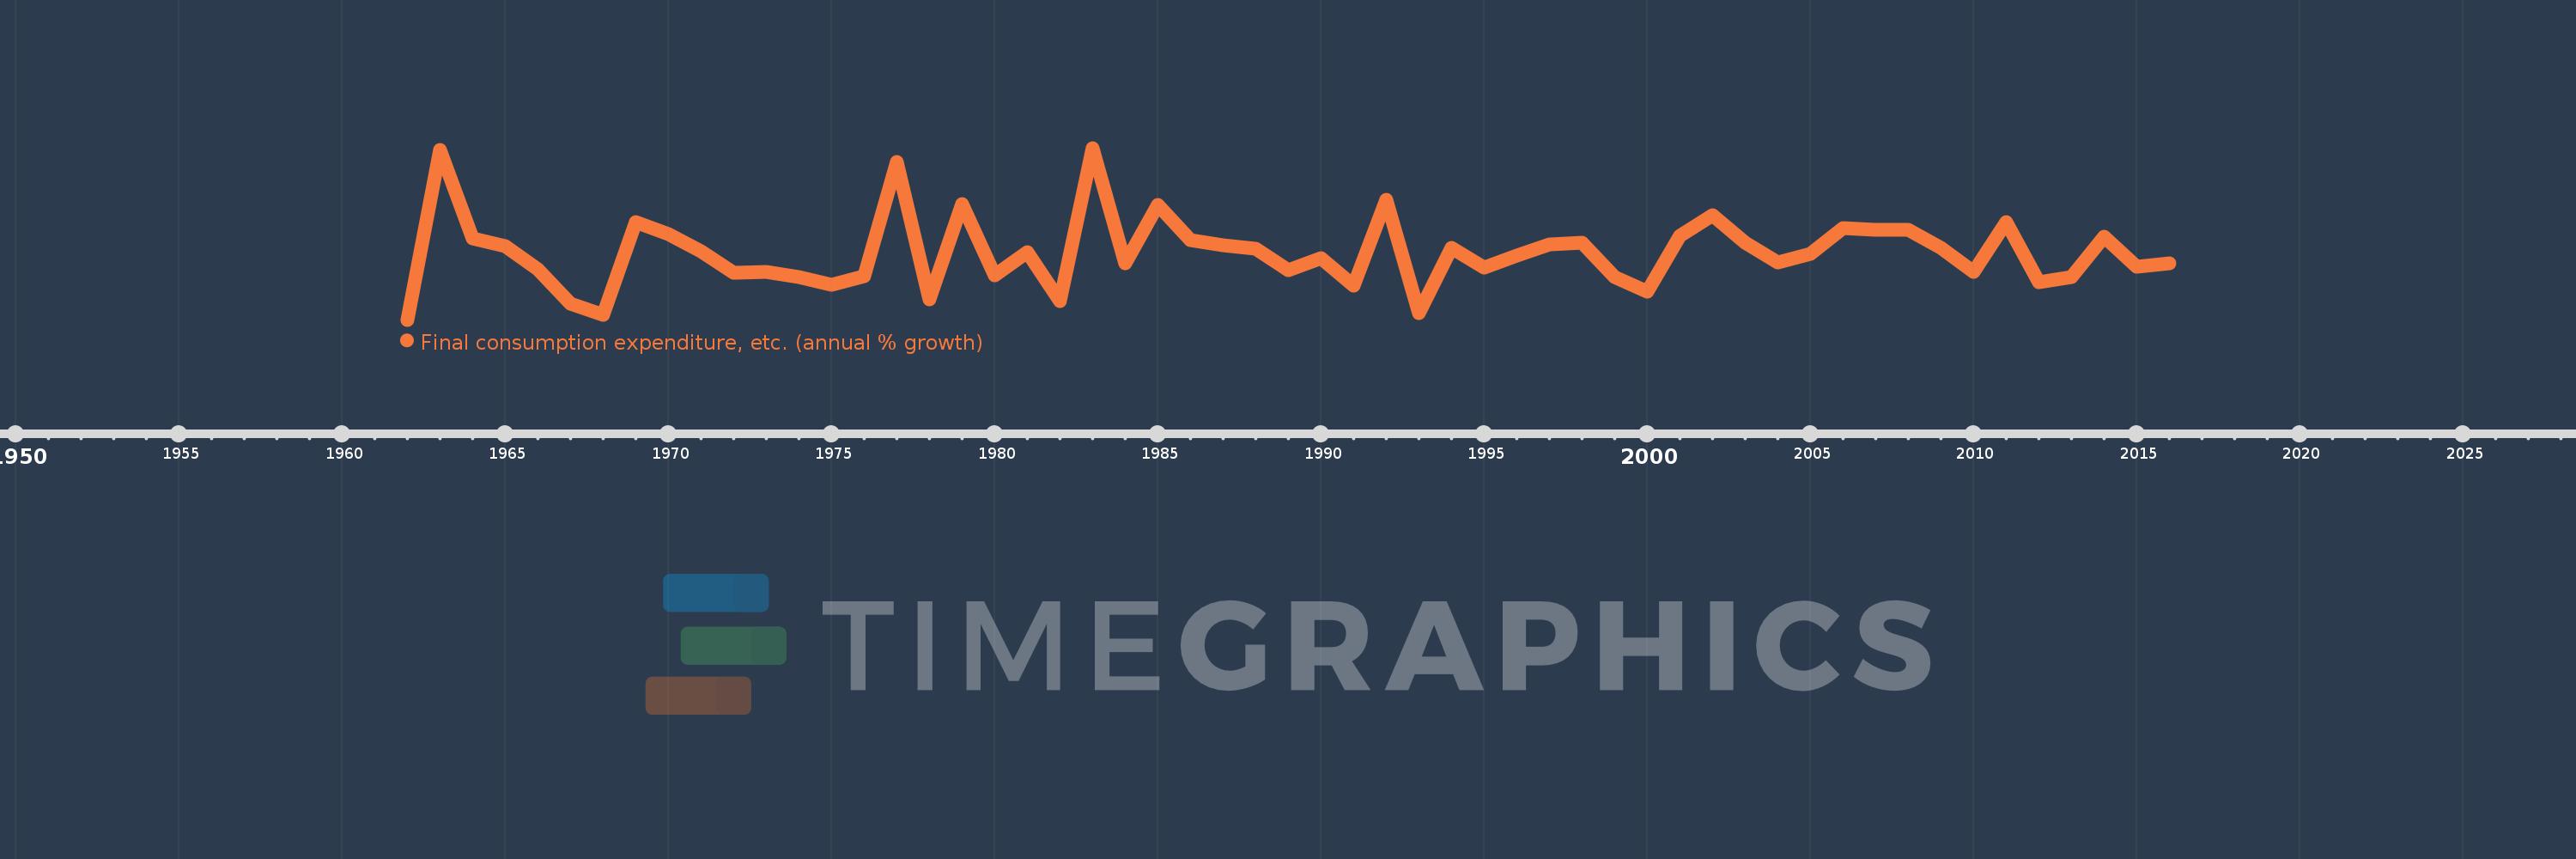
Final consumption expenditure, etc. (annual % growth)
2016,2015,2014,2013,2012,2011,2010,2009,2008,2007,2006,2005,2004,2003,2002,2001,2000,1999,1998,1997,1996,1995,1994,1993,1992,1991,1990,1989,1988,1987,1986,1985,1984,1983,1982,1981,1980,1979,1978,1977,1976,1975,1974,1973,1972,1971,1970,1969,1968,1967,1966,1965,1964,1963,1962
This statistics in other country:
AlbaniaAlgeriaAntigua and BarbudaArab WorldArgentinaArmeniaAustraliaAustriaAzerbaijanBahamas, TheBahrainBangladeshBarbadosBelarusBelgiumBelizeBeninBhutanBoliviaBosnia and HerzegovinaBotswanaBrazilBrunei DarussalamBulgariaBurkina FasoBurundiCabo VerdeCambodiaCameroonCanadaCaribbean small statesCentral Europe and the BalticsChadChileColombiaComorosCongo, Dem. Rep.Congo, Rep.Costa RicaCote d'IvoireCroatiaCubaCyprusCzech RepublicDenmarkDjiboutiDominican RepublicEarly-demographic dividendEast Asia & PacificEcuadorEgypt, Arab Rep.El SalvadorEquatorial GuineaEritreaEstoniaEthiopiaEuro areaEurope & Central AsiaEurope & Central Asia (excluding high income)Europe & Central Asia (IDA & IBRD countries)European UnionFijiFinlandFranceGabonGambia, TheGeorgiaGermanyGhanaGreeceGuatemalaGuineaGuinea-BissauHaitiHeavily indebted poor countries (HIPC)High incomeHondurasHong Kong SAR, ChinaHungaryIBRD onlyIcelandIDA & IBRD totalIDA blendIDA onlyIDA totalIndiaIndonesiaIran, Islamic Rep.IrelandIsraelItalyJamaicaJapanJordanKazakhstanKenyaKorea, Rep.KosovoKuwaitKyrgyz RepublicLao PDRLatin America & Caribbean Latin America & Caribbean (excluding high income)Latin America & the Caribbean (IDA & IBRD countries)LatviaLeast developed countries: UN classificationLebanonLiberiaLithuaniaLow & middle incomeLow incomeLower middle incomeLuxembourgMacao SAR, ChinaMacedonia, FYRMadagascarMalawiMalaysiaMaliMaltaMauritaniaMauritiusMexicoMiddle East & North AfricaMiddle East & North Africa (excluding high income)Middle East & North Africa (IDA & IBRD countries)Middle incomeMoldovaMongoliaMontenegroMoroccoMozambiqueNamibiaNepalNetherlandsNew ZealandNicaraguaNigerNigeriaNorth AmericaNorwayOECD membersOmanOther small statesPakistanPanamaPapua New GuineaParaguayPeruPhilippinesPolandPortugalPost-demographic dividendPre-demographic dividendPuerto RicoQatarRomaniaRussian FederationRwandaSaudi ArabiaSenegalSerbiaSeychellesSierra LeoneSingaporeSlovak RepublicSloveniaSmall statesSomaliaSouth AfricaSouth AsiaSouth Asia (IDA & IBRD)South SudanSpainSri LankaSub-Saharan Africa Sub-Saharan Africa (excluding high income)Sub-Saharan Africa (IDA & IBRD countries)SudanSurinameSwazilandSwedenSwitzerlandSyrian Arab RepublicTajikistanTanzaniaThailandTimor-LesteTogoTrinidad and TobagoTunisiaTurkeyTurkmenistanUgandaUkraineUnited Arab EmiratesUnited KingdomUnited StatesUpper middle incomeUruguayUzbekistanVanuatuVenezuela, RBVietnamWest Bank and GazaWorldZimbabwe Timeline:
This timeline shows a graph from 1962 to 2016 of Congo, Rep.. No data until 1961. Number of actual observations by date: 55.
Source name:
World Development Indicators
Source organization:
World Bank national accounts data, and OECD National Accounts data files.
Categories, topics:
Economy & Growth
Last updated:
apr 23, 2017
Indicators value changes by year
Minimum:
-18.43
jan 1, 1962
Maximum:
42.328
jan 1, 1983
At the date of observation
Value
Absolute change
Change from previous value
jan 1, 1962
-18.43
-18.43
0.0%
jan 1, 1963
41.777
+60.207
-326.68%
jan 1, 1964
10.368
-31.409
-75.18%
jan 1, 1965
7.568
-2.8
-27.01%
jan 1, 1966
-0.653
-8.22
-108.62%
jan 1, 1967
-12.797
-12.144
1.86K%
jan 1, 1968
-16.833
-4.036
31.54%
jan 1, 1969
16.116
+32.948
-195.74%
jan 1, 1970
11.824
-4.291
-26.63%
jan 1, 1971
5.77
-6.055
-51.2%
jan 1, 1972
-1.872
-7.641
-132.44%
jan 1, 1973
-1.51
+0.361
-19.3%
jan 1, 1974
-3.45
-1.94
128.43%
jan 1, 1975
-5.96
-2.51
72.75%
jan 1, 1976
-2.88
+3.08
-51.67%
jan 1, 1977
37.408
+40.288
-1.4K%
jan 1, 1978
-11.203
-48.611
-129.95%
jan 1, 1979
22.567
+33.77
-301.43%
jan 1, 1980
-2.832
-25.399
-112.55%
jan 1, 1981
5.341
+8.173
-288.56%
jan 1, 1982
-11.862
-17.202
-322.11%
jan 1, 1983
42.328
+54.19
-456.84%
jan 1, 1984
1.533
-40.795
-96.38%
jan 1, 1985
22.101
+20.568
1.34K%
jan 1, 1986
9.668
-12.433
-56.26%
jan 1, 1987
7.863
-1.805
-18.67%
jan 1, 1988
6.636
-1.227
-15.61%
jan 1, 1989
-0.798
-7.434
-112.02%
jan 1, 1990
3.392
+4.189
-525.19%
jan 1, 1991
-6.438
-9.829
-289.81%
jan 1, 1992
23.993
+30.431
-472.71%
jan 1, 1993
-16.18
-40.173
-167.43%
jan 1, 1994
7.066
+23.246
-143.67%
jan 1, 1995
-0.009
-7.075
-100.13%
jan 1, 1996
4.156
+4.165
-45.13K%
jan 1, 1997
8.297
+4.141
99.64%
jan 1, 1998
8.809
+0.512
6.17%
jan 1, 1999
-3.415
-12.224
-138.77%
jan 1, 2000
-8.409
-4.994
146.23%
jan 1, 2001
11.329
+19.738
-234.74%
jan 1, 2002
18.477
+7.148
63.09%
jan 1, 2003
8.714
-9.763
-52.84%
jan 1, 2004
1.899
-6.816
-78.21%
jan 1, 2005
4.745
+2.846
149.89%
jan 1, 2006
14.066
+9.321
196.46%
jan 1, 2007
13.344
-0.722
-5.13%
jan 1, 2008
13.492
+0.147
1.1%
jan 1, 2009
7.105
-6.387
-47.34%
jan 1, 2010
-1.477
-8.582
-120.79%
jan 1, 2011
16.176
+17.653
-1.19K%
jan 1, 2012
-5.261
-21.437
-132.52%
jan 1, 2013
-3.449
+1.812
-34.45%
jan 1, 2014
11.047
+14.495
-420.32%
jan 1, 2015
0.384
-10.663
-96.53%
jan 1, 2016
1.438
+1.055
275.02%
Ranking of countries by current statistics by years


Comments: