29
/
en
AIzaSyAYiBZKx7MnpbEhh9jyipgxe19OcubqV5w
April 1, 2024
101053
Canada
CAN
true
2
1
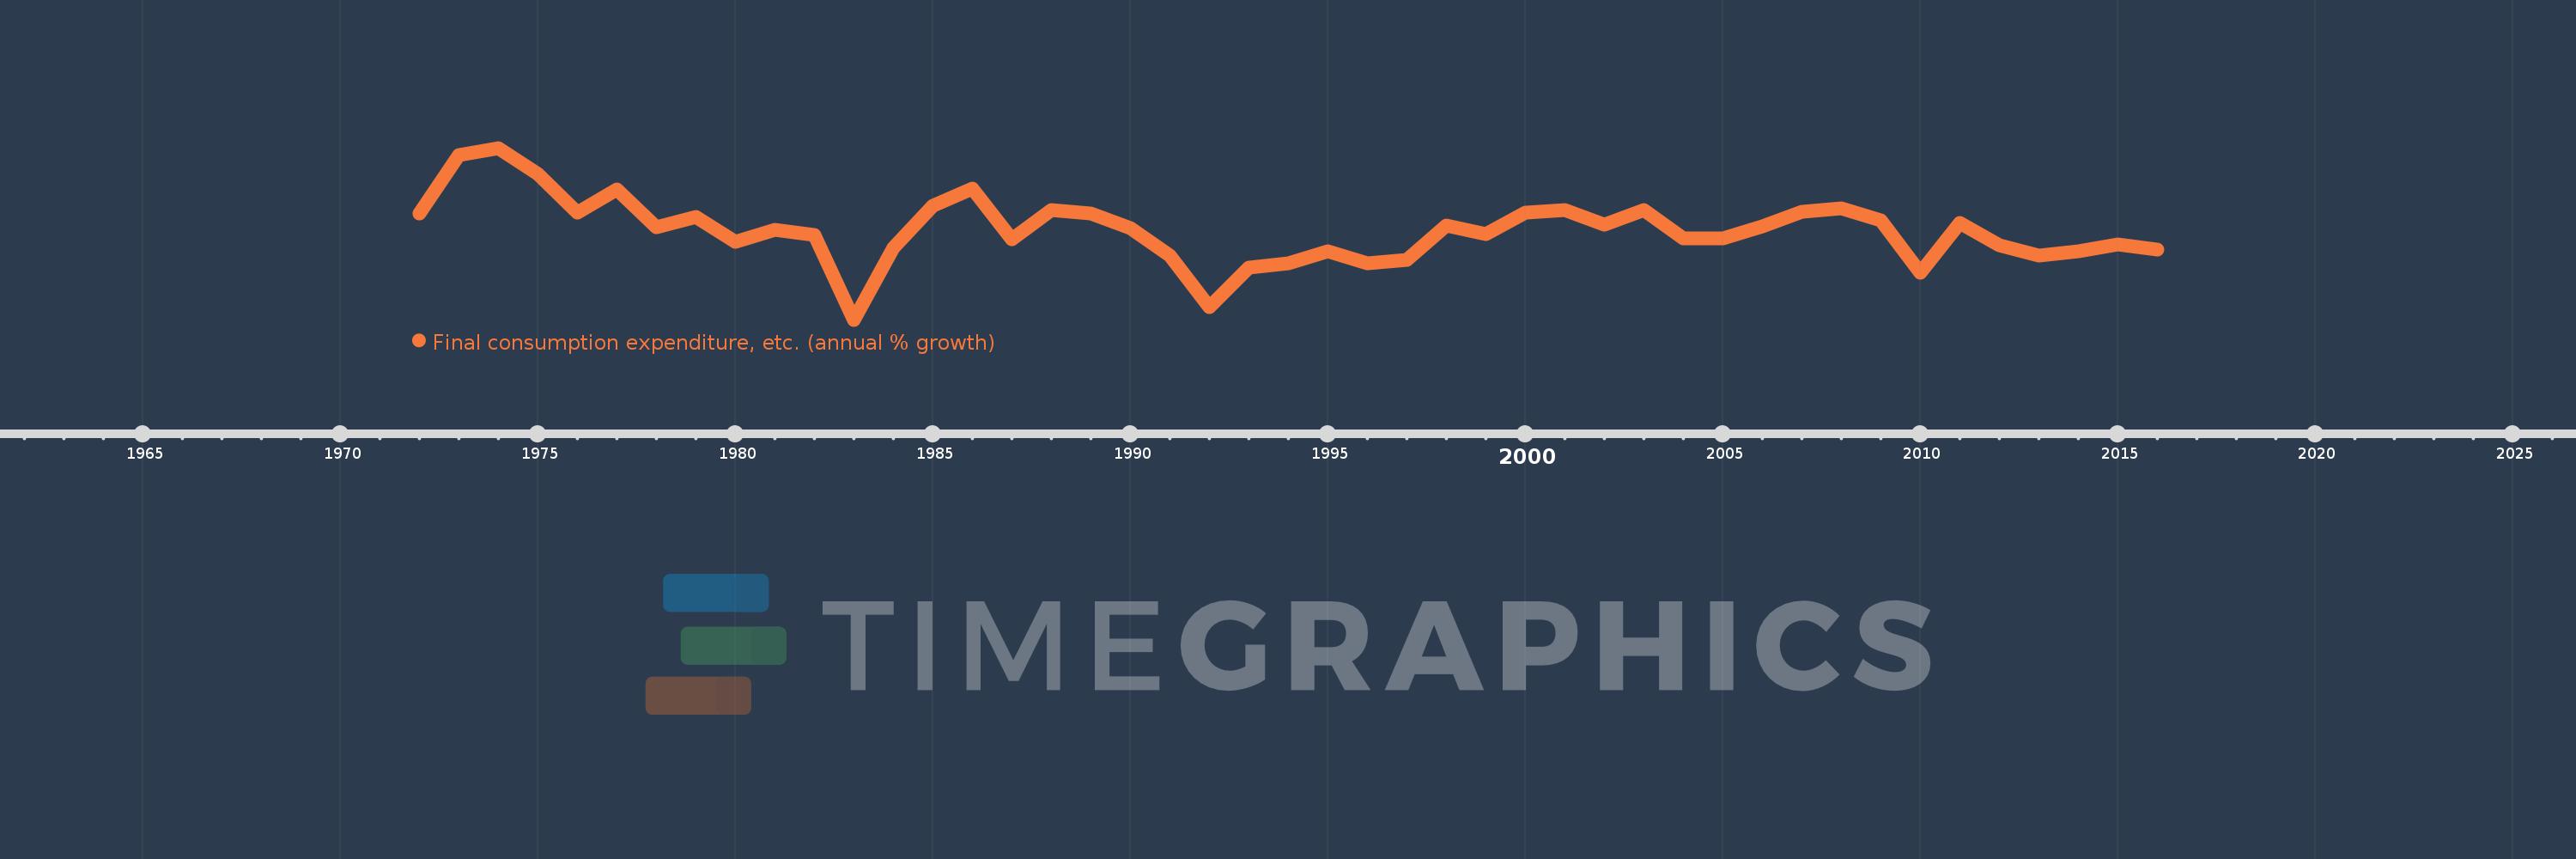
Final consumption expenditure, etc. (annual % growth)
2016,2015,2014,2013,2012,2011,2010,2009,2008,2007,2006,2005,2004,2003,2002,2001,2000,1999,1998,1997,1996,1995,1994,1993,1992,1991,1990,1989,1988,1987,1986,1985,1984,1983,1982,1981,1980,1979,1978,1977,1976,1975,1974,1973,1972
This statistics in other country:
AlbaniaAlgeriaAntigua and BarbudaArab WorldArgentinaArmeniaAustraliaAustriaAzerbaijanBahamas, TheBahrainBangladeshBarbadosBelarusBelgiumBelizeBeninBhutanBoliviaBosnia and HerzegovinaBotswanaBrazilBrunei DarussalamBulgariaBurkina FasoBurundiCabo VerdeCambodiaCameroonCanadaCaribbean small statesCentral Europe and the BalticsChadChileColombiaComorosCongo, Dem. Rep.Congo, Rep.Costa RicaCote d'IvoireCroatiaCubaCyprusCzech RepublicDenmarkDjiboutiDominican RepublicEarly-demographic dividendEast Asia & PacificEcuadorEgypt, Arab Rep.El SalvadorEquatorial GuineaEritreaEstoniaEthiopiaEuro areaEurope & Central AsiaEurope & Central Asia (excluding high income)Europe & Central Asia (IDA & IBRD countries)European UnionFijiFinlandFranceGabonGambia, TheGeorgiaGermanyGhanaGreeceGuatemalaGuineaGuinea-BissauHaitiHeavily indebted poor countries (HIPC)High incomeHondurasHong Kong SAR, ChinaHungaryIBRD onlyIcelandIDA & IBRD totalIDA blendIDA onlyIDA totalIndiaIndonesiaIran, Islamic Rep.IrelandIsraelItalyJamaicaJapanJordanKazakhstanKenyaKorea, Rep.KosovoKuwaitKyrgyz RepublicLao PDRLatin America & Caribbean Latin America & Caribbean (excluding high income)Latin America & the Caribbean (IDA & IBRD countries)LatviaLeast developed countries: UN classificationLebanonLiberiaLithuaniaLow & middle incomeLow incomeLower middle incomeLuxembourgMacao SAR, ChinaMacedonia, FYRMadagascarMalawiMalaysiaMaliMaltaMauritaniaMauritiusMexicoMiddle East & North AfricaMiddle East & North Africa (excluding high income)Middle East & North Africa (IDA & IBRD countries)Middle incomeMoldovaMongoliaMontenegroMoroccoMozambiqueNamibiaNepalNetherlandsNew ZealandNicaraguaNigerNigeriaNorth AmericaNorwayOECD membersOmanOther small statesPakistanPanamaPapua New GuineaParaguayPeruPhilippinesPolandPortugalPost-demographic dividendPre-demographic dividendPuerto RicoQatarRomaniaRussian FederationRwandaSaudi ArabiaSenegalSerbiaSeychellesSierra LeoneSingaporeSlovak RepublicSloveniaSmall statesSomaliaSouth AfricaSouth AsiaSouth Asia (IDA & IBRD)South SudanSpainSri LankaSub-Saharan Africa Sub-Saharan Africa (excluding high income)Sub-Saharan Africa (IDA & IBRD countries)SudanSurinameSwazilandSwedenSwitzerlandSyrian Arab RepublicTajikistanTanzaniaThailandTimor-LesteTogoTrinidad and TobagoTunisiaTurkeyTurkmenistanUgandaUkraineUnited Arab EmiratesUnited KingdomUnited StatesUpper middle incomeUruguayUzbekistanVanuatuVenezuela, RBVietnamWest Bank and GazaWorldZimbabwe Timeline:
This timeline shows a graph from 1972 to 2016 of Canada. No data until 1971. Number of actual observations by date: 45.
Source name:
World Development Indicators
Source organization:
World Bank national accounts data, and OECD National Accounts data files.
Categories, topics:
Economy & Growth
Last updated:
apr 23, 2017
Indicators value changes by year
Minimum:
-1.307
jan 1, 1983
At the date of observation
Value
Absolute change
Change from previous value
jan 1, 1972
3.498
+3.498
0.0%
jan 1, 1973
6.128
+2.63
75.19%
jan 1, 1974
6.456
+0.328
5.35%
jan 1, 1975
5.281
-1.175
-18.2%
jan 1, 1976
3.521
-1.759
-33.32%
jan 1, 1977
4.581
+1.06
30.09%
jan 1, 1978
2.857
-1.724
-37.63%
jan 1, 1979
3.347
+0.49
17.17%
jan 1, 1980
2.217
-1.131
-33.78%
jan 1, 1981
2.74
+0.523
23.59%
jan 1, 1982
2.507
-0.232
-8.48%
jan 1, 1983
-1.307
-3.815
-152.15%
jan 1, 1984
1.928
+3.236
-247.5%
jan 1, 1985
3.856
+1.928
99.96%
jan 1, 1986
4.632
+0.776
20.12%
jan 1, 1987
2.348
-2.284
-49.31%
jan 1, 1988
3.648
+1.3
55.38%
jan 1, 1989
3.512
-0.136
-3.72%
jan 1, 1990
2.829
-0.683
-19.45%
jan 1, 1991
1.58
-1.249
-44.16%
jan 1, 1992
-0.73
-2.31
-146.21%
jan 1, 1993
1.059
+1.789
-245.11%
jan 1, 1994
1.227
+0.168
15.85%
jan 1, 1995
1.795
+0.567
46.24%
jan 1, 1996
1.225
-0.57
-31.73%
jan 1, 1997
1.384
+0.159
12.98%
jan 1, 1998
2.939
+1.555
112.32%
jan 1, 1999
2.562
-0.377
-12.84%
jan 1, 2000
3.526
+0.964
37.64%
jan 1, 2001
3.668
+0.141
4.01%
jan 1, 2002
3.002
-0.666
-18.15%
jan 1, 2003
3.662
+0.661
22.01%
jan 1, 2004
2.363
-1.299
-35.47%
jan 1, 2005
2.36
-0.003
-0.13%
jan 1, 2006
2.899
+0.539
22.82%
jan 1, 2007
3.553
+0.654
22.58%
jan 1, 2008
3.719
+0.166
4.67%
jan 1, 2009
3.2
-0.519
-13.95%
jan 1, 2010
0.812
-2.389
-74.64%
jan 1, 2011
3.086
+2.274
280.18%
jan 1, 2012
2.052
-1.034
-33.5%
jan 1, 2013
1.592
-0.46
-22.41%
jan 1, 2014
1.795
+0.202
12.72%
jan 1, 2015
2.105
+0.31
17.29%
jan 1, 2016
1.847
-0.258
-12.25%
Ranking of countries by current statistics by years


Comments: