29
/
en
AIzaSyAYiBZKx7MnpbEhh9jyipgxe19OcubqV5w
April 1, 2024
94824
Burkina Faso
BFA
true
2
1
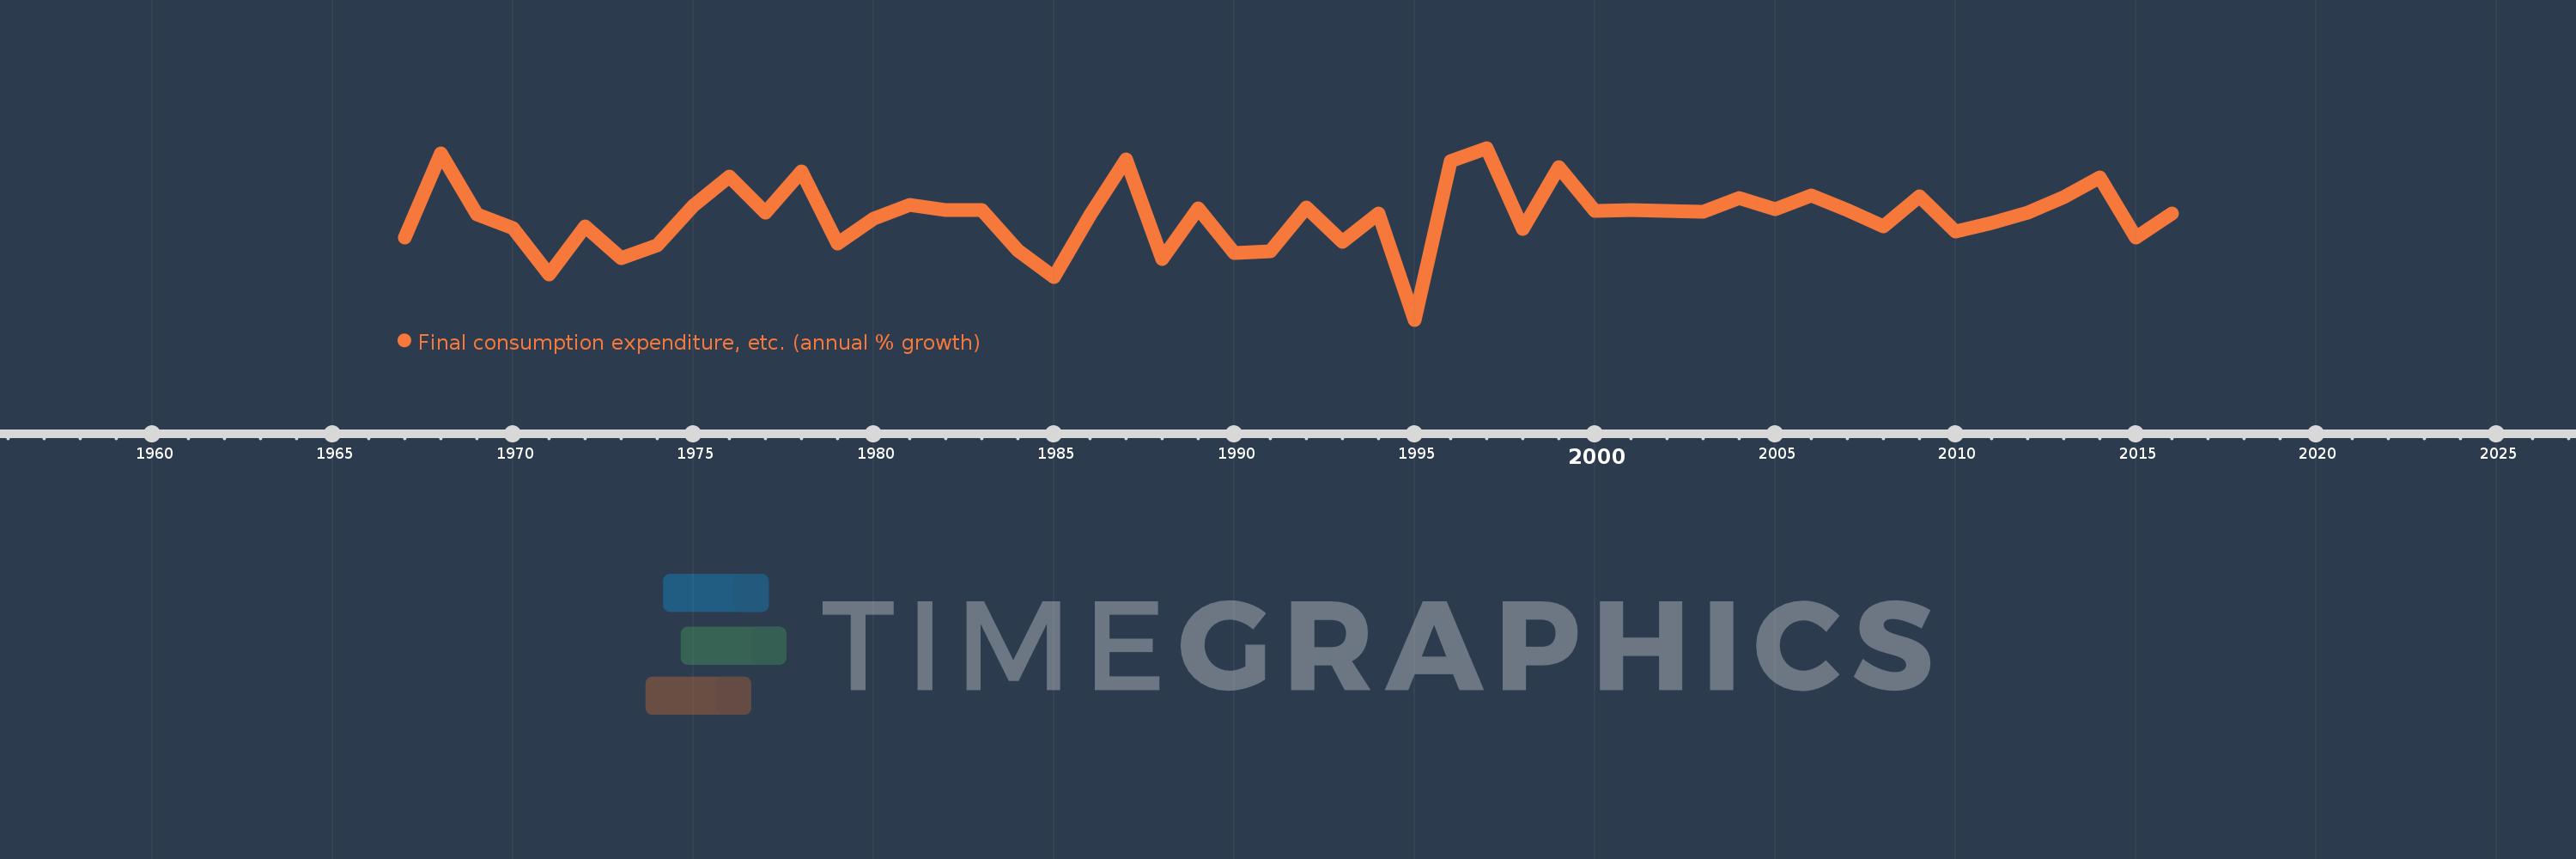
Final consumption expenditure, etc. (annual % growth)
2016,2015,2014,2013,2012,2011,2010,2009,2008,2007,2006,2005,2004,2003,2002,2001,2000,1999,1998,1997,1996,1995,1994,1993,1992,1991,1990,1989,1988,1987,1986,1985,1984,1983,1982,1981,1980,1979,1978,1977,1976,1975,1974,1973,1972,1971,1970,1969,1968,1967
This statistics in other country:
AlbaniaAlgeriaAntigua and BarbudaArab WorldArgentinaArmeniaAustraliaAustriaAzerbaijanBahamas, TheBahrainBangladeshBarbadosBelarusBelgiumBelizeBeninBhutanBoliviaBosnia and HerzegovinaBotswanaBrazilBrunei DarussalamBulgariaBurkina FasoBurundiCabo VerdeCambodiaCameroonCanadaCaribbean small statesCentral Europe and the BalticsChadChileColombiaComorosCongo, Dem. Rep.Congo, Rep.Costa RicaCote d'IvoireCroatiaCubaCyprusCzech RepublicDenmarkDjiboutiDominican RepublicEarly-demographic dividendEast Asia & PacificEcuadorEgypt, Arab Rep.El SalvadorEquatorial GuineaEritreaEstoniaEthiopiaEuro areaEurope & Central AsiaEurope & Central Asia (excluding high income)Europe & Central Asia (IDA & IBRD countries)European UnionFijiFinlandFranceGabonGambia, TheGeorgiaGermanyGhanaGreeceGuatemalaGuineaGuinea-BissauHaitiHeavily indebted poor countries (HIPC)High incomeHondurasHong Kong SAR, ChinaHungaryIBRD onlyIcelandIDA & IBRD totalIDA blendIDA onlyIDA totalIndiaIndonesiaIran, Islamic Rep.IrelandIsraelItalyJamaicaJapanJordanKazakhstanKenyaKorea, Rep.KosovoKuwaitKyrgyz RepublicLao PDRLatin America & Caribbean Latin America & Caribbean (excluding high income)Latin America & the Caribbean (IDA & IBRD countries)LatviaLeast developed countries: UN classificationLebanonLiberiaLithuaniaLow & middle incomeLow incomeLower middle incomeLuxembourgMacao SAR, ChinaMacedonia, FYRMadagascarMalawiMalaysiaMaliMaltaMauritaniaMauritiusMexicoMiddle East & North AfricaMiddle East & North Africa (excluding high income)Middle East & North Africa (IDA & IBRD countries)Middle incomeMoldovaMongoliaMontenegroMoroccoMozambiqueNamibiaNepalNetherlandsNew ZealandNicaraguaNigerNigeriaNorth AmericaNorwayOECD membersOmanOther small statesPakistanPanamaPapua New GuineaParaguayPeruPhilippinesPolandPortugalPost-demographic dividendPre-demographic dividendPuerto RicoQatarRomaniaRussian FederationRwandaSaudi ArabiaSenegalSerbiaSeychellesSierra LeoneSingaporeSlovak RepublicSloveniaSmall statesSomaliaSouth AfricaSouth AsiaSouth Asia (IDA & IBRD)South SudanSpainSri LankaSub-Saharan Africa Sub-Saharan Africa (excluding high income)Sub-Saharan Africa (IDA & IBRD countries)SudanSurinameSwazilandSwedenSwitzerlandSyrian Arab RepublicTajikistanTanzaniaThailandTimor-LesteTogoTrinidad and TobagoTunisiaTurkeyTurkmenistanUgandaUkraineUnited Arab EmiratesUnited KingdomUnited StatesUpper middle incomeUruguayUzbekistanVanuatuVenezuela, RBVietnamWest Bank and GazaWorldZimbabwe Timeline:
This timeline shows a graph from 1967 to 2016 of Burkina Faso. No data until 1966. Number of actual observations by date: 50.
Source name:
World Development Indicators
Source organization:
World Bank national accounts data, and OECD National Accounts data files.
Categories, topics:
Economy & Growth
Last updated:
apr 23, 2017
Indicators value changes by year
Minimum:
-11.859
jan 1, 1995
Maximum:
14.537
jan 1, 1997
At the date of observation
Value
Absolute change
Change from previous value
jan 1, 1967
0.78
+0.78
0.0%
jan 1, 1968
13.729
+12.949
1.66K%
jan 1, 1969
4.383
-9.346
-68.08%
jan 1, 1970
2.183
-2.199
-50.18%
jan 1, 1971
-4.912
-7.095
-324.97%
jan 1, 1972
2.553
+7.465
-151.97%
jan 1, 1973
-2.412
-4.965
-194.49%
jan 1, 1974
-0.421
+1.991
-82.54%
jan 1, 1975
5.675
+6.096
-1.45K%
jan 1, 1976
10.202
+4.527
79.77%
jan 1, 1977
4.623
-5.579
-54.68%
jan 1, 1978
10.914
+6.291
136.07%
jan 1, 1979
-0.203
-11.117
-101.86%
jan 1, 1980
3.687
+3.889
-1.92K%
jan 1, 1981
5.751
+2.064
55.98%
jan 1, 1982
5.023
-0.728
-12.65%
jan 1, 1983
4.951
-0.072
-1.44%
jan 1, 1984
-1.221
-6.171
-124.66%
jan 1, 1985
-5.31
-4.089
335.01%
jan 1, 1986
4.259
+9.569
-180.19%
jan 1, 1987
12.785
+8.527
200.23%
jan 1, 1988
-2.47
-15.255
-119.32%
jan 1, 1989
5.247
+7.717
-312.43%
jan 1, 1990
-1.624
-6.871
-130.95%
jan 1, 1991
-1.32
+0.305
-18.75%
jan 1, 1992
5.454
+6.774
-513.31%
jan 1, 1993
0.111
-5.343
-97.97%
jan 1, 1994
4.521
+4.411
3.98K%
jan 1, 1995
-11.859
-16.381
-362.3%
jan 1, 1996
12.513
+24.373
-205.51%
jan 1, 1997
14.537
+2.023
16.17%
jan 1, 1998
2.089
-12.448
-85.63%
jan 1, 1999
11.584
+9.496
454.63%
jan 1, 2000
4.916
-6.669
-57.56%
jan 1, 2001
5.011
+0.095
1.93%
jan 1, 2002
4.849
-0.162
-3.24%
jan 1, 2003
4.705
-0.143
-2.95%
jan 1, 2004
6.854
+2.148
45.66%
jan 1, 2005
5.183
-1.671
-24.37%
jan 1, 2006
7.278
+2.095
40.41%
jan 1, 2007
5.05
-2.228
-30.62%
jan 1, 2008
2.496
-2.554
-50.57%
jan 1, 2009
7.109
+4.613
184.79%
jan 1, 2010
1.689
-5.42
-76.24%
jan 1, 2011
2.97
+1.281
75.82%
jan 1, 2012
4.625
+1.655
55.71%
jan 1, 2013
7.014
+2.389
51.66%
jan 1, 2014
10.007
+2.993
42.68%
jan 1, 2015
0.788
-9.22
-92.13%
jan 1, 2016
4.476
+3.689
468.36%
Ranking of countries by current statistics by years


Comments: