29
/
en
AIzaSyAYiBZKx7MnpbEhh9jyipgxe19OcubqV5w
April 1, 2024
58888
Sub-Saharan Africa
SSF
false
2
1
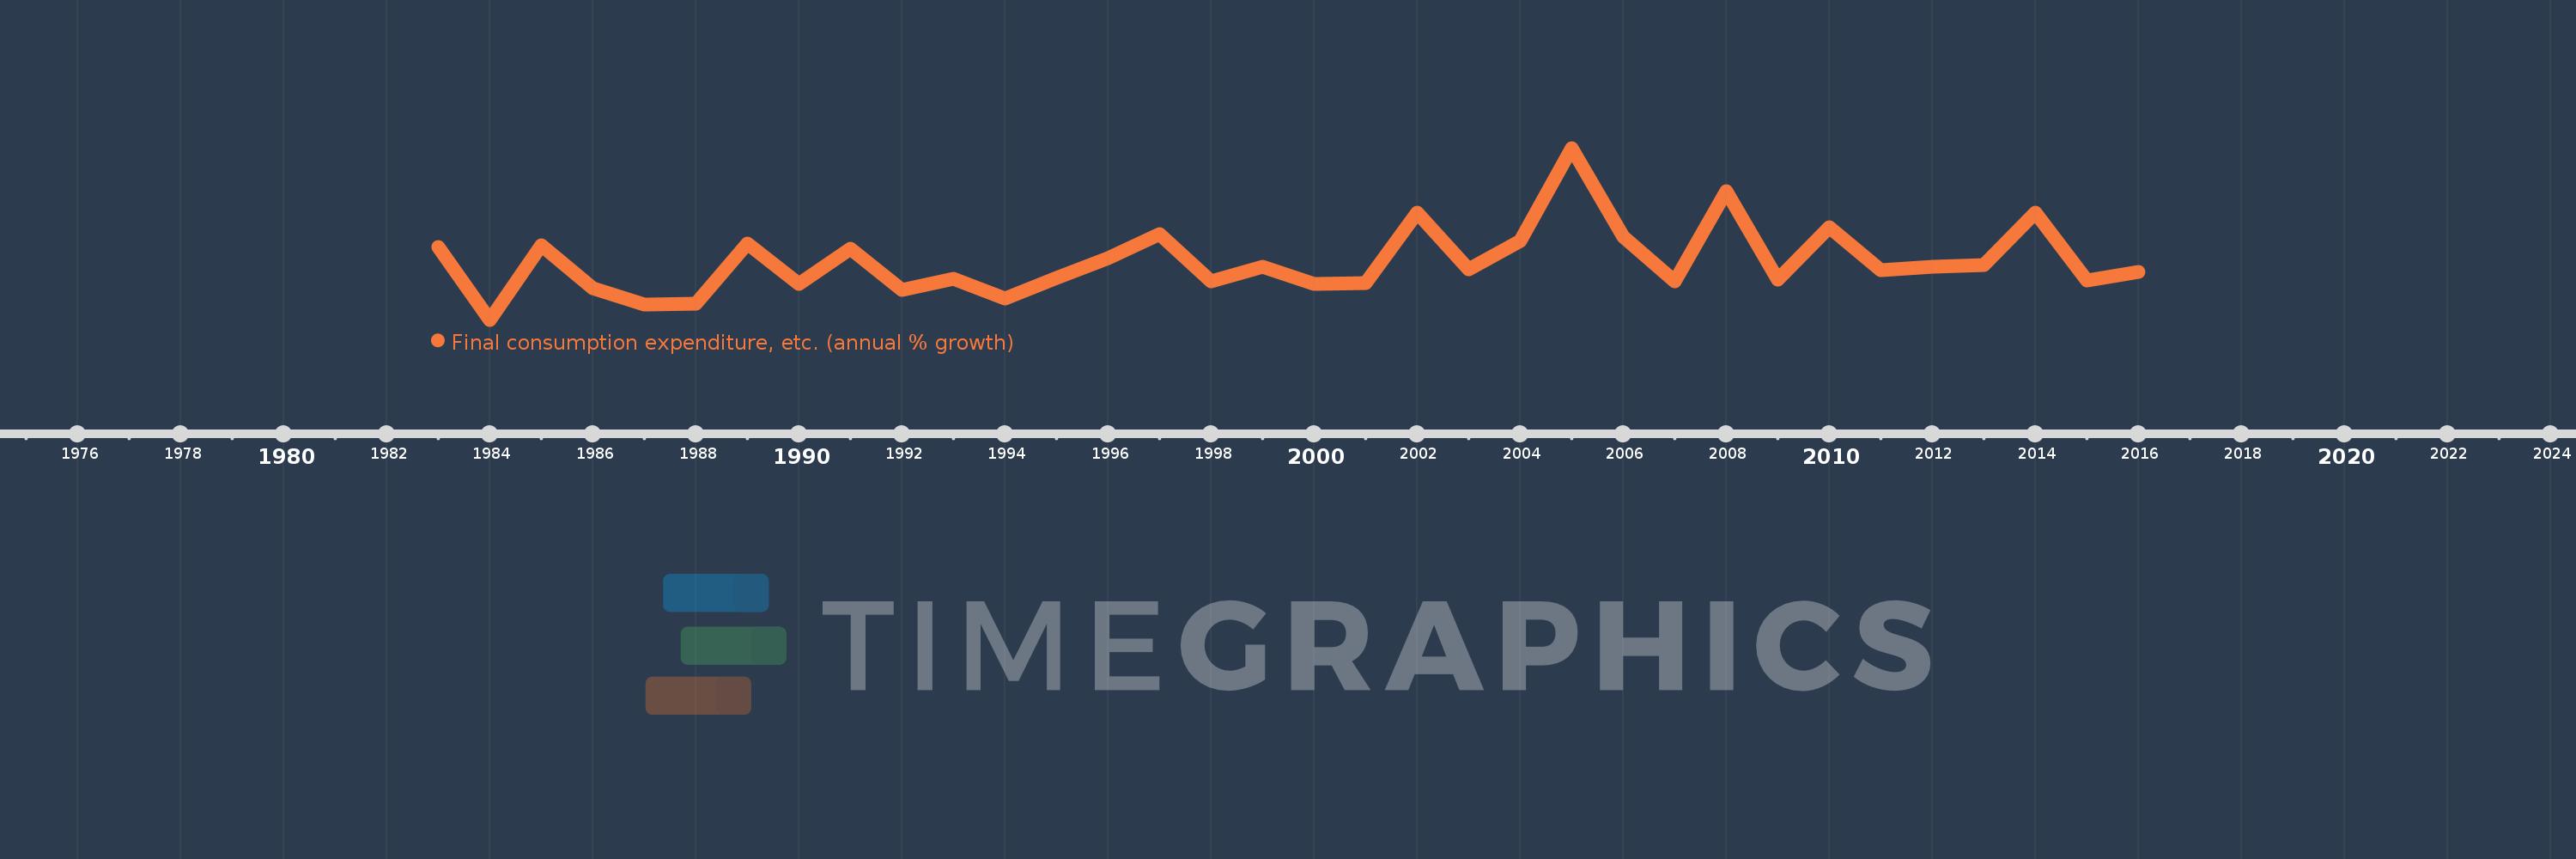
Final consumption expenditure, etc. (annual % growth)
2016,2015,2014,2013,2012,2011,2010,2009,2008,2007,2006,2005,2004,2003,2002,2001,2000,1999,1998,1997,1996,1995,1994,1993,1992,1991,1990,1989,1988,1987,1986,1985,1984,1983
This statistics in other country:
AlbaniaAlgeriaAntigua and BarbudaArab WorldArgentinaArmeniaAustraliaAustriaAzerbaijanBahamas, TheBahrainBangladeshBarbadosBelarusBelgiumBelizeBeninBhutanBoliviaBosnia and HerzegovinaBotswanaBrazilBrunei DarussalamBulgariaBurkina FasoBurundiCabo VerdeCambodiaCameroonCanadaCaribbean small statesCentral Europe and the BalticsChadChileColombiaComorosCongo, Dem. Rep.Congo, Rep.Costa RicaCote d'IvoireCroatiaCubaCyprusCzech RepublicDenmarkDjiboutiDominican RepublicEarly-demographic dividendEast Asia & PacificEcuadorEgypt, Arab Rep.El SalvadorEquatorial GuineaEritreaEstoniaEthiopiaEuro areaEurope & Central AsiaEurope & Central Asia (excluding high income)Europe & Central Asia (IDA & IBRD countries)European UnionFijiFinlandFranceGabonGambia, TheGeorgiaGermanyGhanaGreeceGuatemalaGuineaGuinea-BissauHaitiHeavily indebted poor countries (HIPC)High incomeHondurasHong Kong SAR, ChinaHungaryIBRD onlyIcelandIDA & IBRD totalIDA blendIDA onlyIDA totalIndiaIndonesiaIran, Islamic Rep.IrelandIsraelItalyJamaicaJapanJordanKazakhstanKenyaKorea, Rep.KosovoKuwaitKyrgyz RepublicLao PDRLatin America & Caribbean Latin America & Caribbean (excluding high income)Latin America & the Caribbean (IDA & IBRD countries)LatviaLeast developed countries: UN classificationLebanonLiberiaLithuaniaLow & middle incomeLow incomeLower middle incomeLuxembourgMacao SAR, ChinaMacedonia, FYRMadagascarMalawiMalaysiaMaliMaltaMauritaniaMauritiusMexicoMiddle East & North AfricaMiddle East & North Africa (excluding high income)Middle East & North Africa (IDA & IBRD countries)Middle incomeMoldovaMongoliaMontenegroMoroccoMozambiqueNamibiaNepalNetherlandsNew ZealandNicaraguaNigerNigeriaNorth AmericaNorwayOECD membersOmanOther small statesPakistanPanamaPapua New GuineaParaguayPeruPhilippinesPolandPortugalPost-demographic dividendPre-demographic dividendPuerto RicoQatarRomaniaRussian FederationRwandaSaudi ArabiaSenegalSerbiaSeychellesSierra LeoneSingaporeSlovak RepublicSloveniaSmall statesSomaliaSouth AfricaSouth AsiaSouth Asia (IDA & IBRD)South SudanSpainSri LankaSub-Saharan Africa Sub-Saharan Africa (excluding high income)Sub-Saharan Africa (IDA & IBRD countries)SudanSurinameSwazilandSwedenSwitzerlandSyrian Arab RepublicTajikistanTanzaniaThailandTimor-LesteTogoTrinidad and TobagoTunisiaTurkeyTurkmenistanUgandaUkraineUnited Arab EmiratesUnited KingdomUnited StatesUpper middle incomeUruguayUzbekistanVanuatuVenezuela, RBVietnamWest Bank and GazaWorldZimbabwe Timeline:
This timeline shows a graph from 1983 to 2016 of Sub-Saharan Africa . No data until 1982. Number of actual observations by date: 34.
Source name:
World Development Indicators
Source organization:
World Bank national accounts data, and OECD National Accounts data files.
Categories, topics:
Economy & Growth
Last updated:
apr 23, 2017
Indicators value changes by year
Minimum:
-2.441
jan 1, 1984
Maximum:
14.645
jan 1, 2005
At the date of observation
Value
Absolute change
Change from previous value
jan 1, 1983
4.757
+4.757
0.0%
jan 1, 1984
-2.441
-7.198
-151.3%
jan 1, 1985
4.944
+7.385
-302.59%
jan 1, 1986
0.667
-4.277
-86.5%
jan 1, 1987
-0.92
-1.587
-237.76%
jan 1, 1988
-0.883
+0.037
-4.01%
jan 1, 1989
5.17
+6.052
-685.72%
jan 1, 1990
1.091
-4.078
-78.89%
jan 1, 1991
4.591
+3.499
320.6%
jan 1, 1992
0.517
-4.073
-88.73%
jan 1, 1993
1.596
+1.078
208.41%
jan 1, 1994
-0.315
-1.911
-119.75%
jan 1, 1995
1.734
+2.049
-650.07%
jan 1, 1996
3.662
+1.929
111.25%
jan 1, 1997
6.098
+2.436
66.51%
jan 1, 1998
1.411
-4.687
-76.86%
jan 1, 1999
2.863
+1.452
102.88%
jan 1, 2000
1.114
-1.748
-61.07%
jan 1, 2001
1.227
+0.113
10.12%
jan 1, 2002
8.224
+6.997
570.16%
jan 1, 2003
2.61
-5.615
-68.27%
jan 1, 2004
5.405
+2.795
107.08%
jan 1, 2005
14.645
+9.24
170.97%
jan 1, 2006
5.834
-8.811
-60.16%
jan 1, 2007
1.405
-4.428
-75.91%
jan 1, 2008
10.387
+8.981
639.07%
jan 1, 2009
1.584
-8.803
-84.75%
jan 1, 2010
6.796
+5.212
329.16%
jan 1, 2011
2.455
-4.341
-63.88%
jan 1, 2012
2.863
+0.408
16.62%
jan 1, 2013
2.986
+0.123
4.3%
jan 1, 2014
8.236
+5.25
175.83%
jan 1, 2015
1.441
-6.795
-82.5%
jan 1, 2016
2.316
+0.875
60.71%
Ranking of countries by current statistics by years


Comments: