29
/
en
AIzaSyAYiBZKx7MnpbEhh9jyipgxe19OcubqV5w
April 1, 2024
52574
OECD members
OED
false
2
1
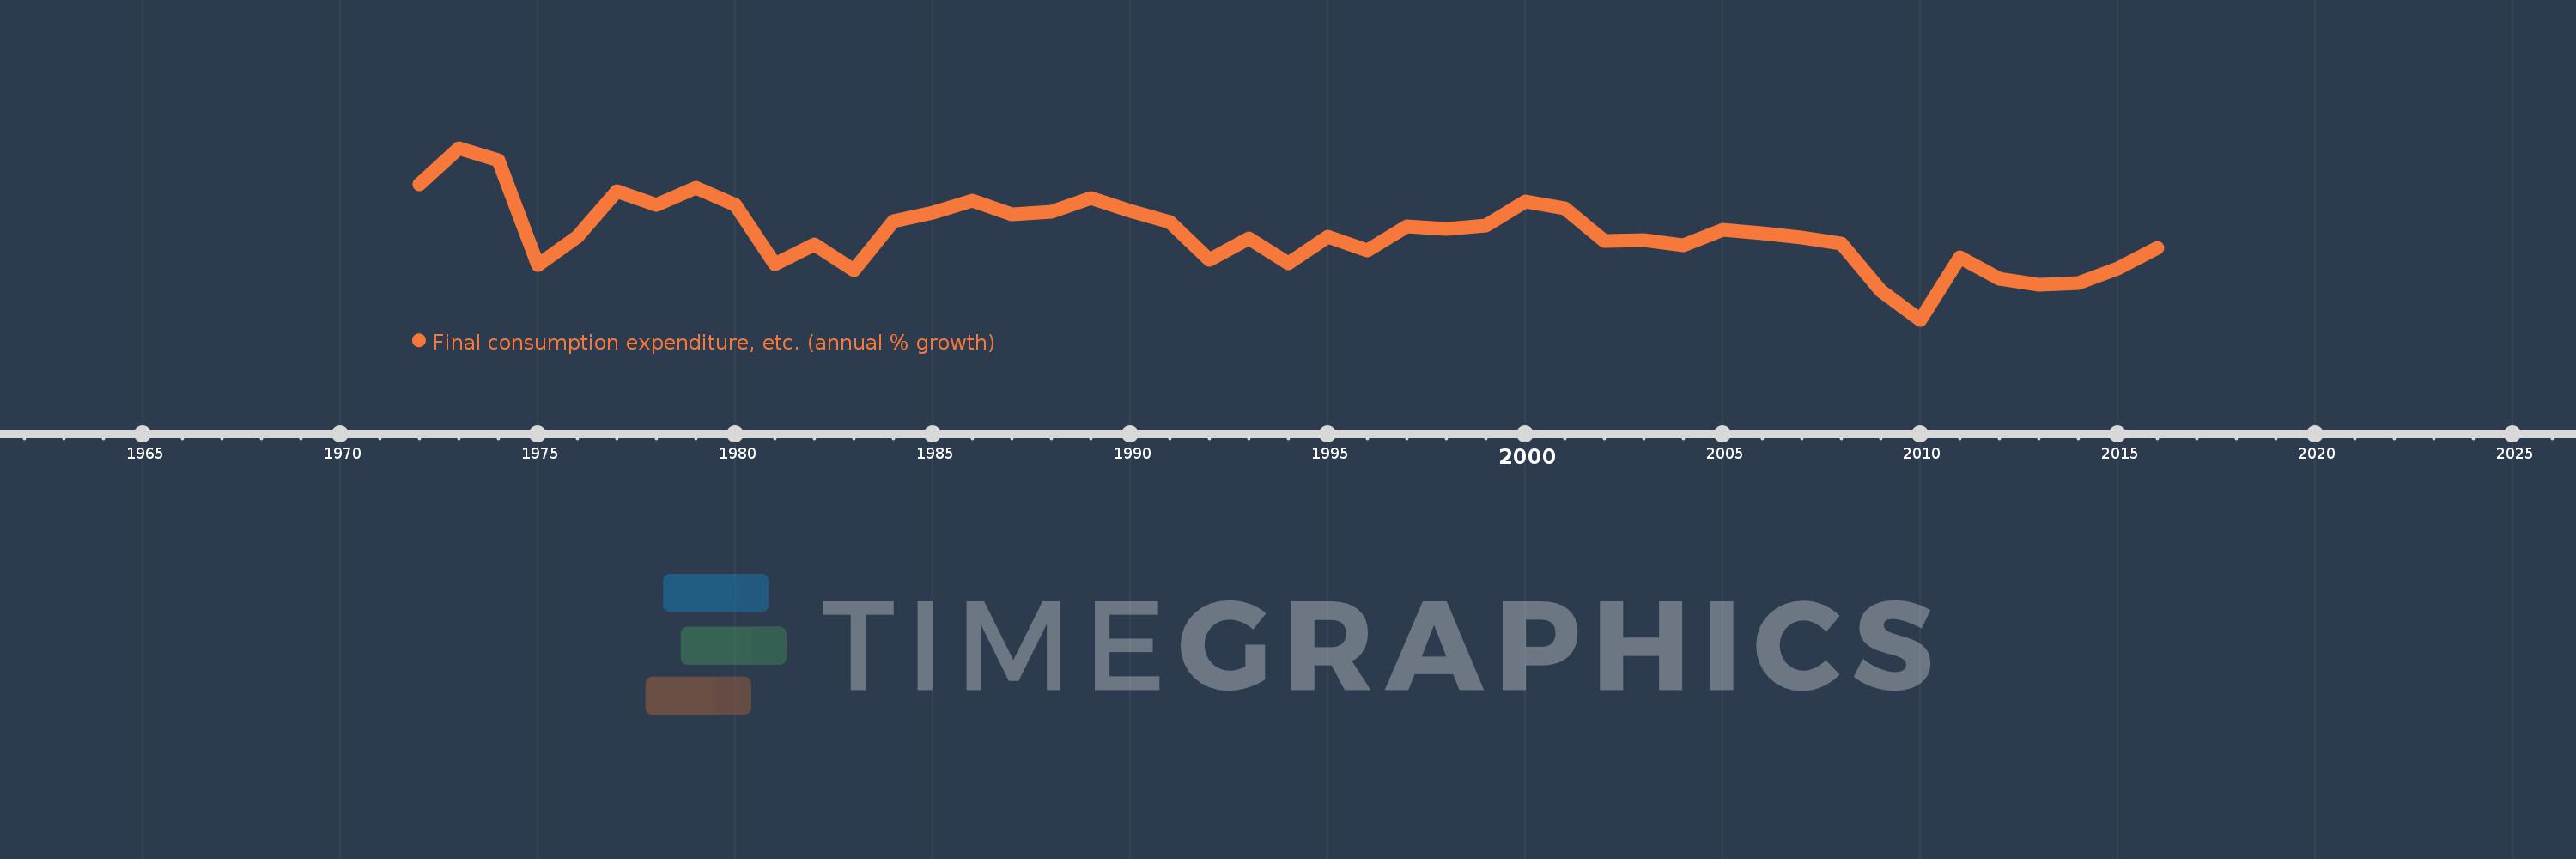
Final consumption expenditure, etc. (annual % growth)
2016,2015,2014,2013,2012,2011,2010,2009,2008,2007,2006,2005,2004,2003,2002,2001,2000,1999,1998,1997,1996,1995,1994,1993,1992,1991,1990,1989,1988,1987,1986,1985,1984,1983,1982,1981,1980,1979,1978,1977,1976,1975,1974,1973,1972
This statistics in other country:
AlbaniaAlgeriaAntigua and BarbudaArab WorldArgentinaArmeniaAustraliaAustriaAzerbaijanBahamas, TheBahrainBangladeshBarbadosBelarusBelgiumBelizeBeninBhutanBoliviaBosnia and HerzegovinaBotswanaBrazilBrunei DarussalamBulgariaBurkina FasoBurundiCabo VerdeCambodiaCameroonCanadaCaribbean small statesCentral Europe and the BalticsChadChileColombiaComorosCongo, Dem. Rep.Congo, Rep.Costa RicaCote d'IvoireCroatiaCubaCyprusCzech RepublicDenmarkDjiboutiDominican RepublicEarly-demographic dividendEast Asia & PacificEcuadorEgypt, Arab Rep.El SalvadorEquatorial GuineaEritreaEstoniaEthiopiaEuro areaEurope & Central AsiaEurope & Central Asia (excluding high income)Europe & Central Asia (IDA & IBRD countries)European UnionFijiFinlandFranceGabonGambia, TheGeorgiaGermanyGhanaGreeceGuatemalaGuineaGuinea-BissauHaitiHeavily indebted poor countries (HIPC)High incomeHondurasHong Kong SAR, ChinaHungaryIBRD onlyIcelandIDA & IBRD totalIDA blendIDA onlyIDA totalIndiaIndonesiaIran, Islamic Rep.IrelandIsraelItalyJamaicaJapanJordanKazakhstanKenyaKorea, Rep.KosovoKuwaitKyrgyz RepublicLao PDRLatin America & Caribbean Latin America & Caribbean (excluding high income)Latin America & the Caribbean (IDA & IBRD countries)LatviaLeast developed countries: UN classificationLebanonLiberiaLithuaniaLow & middle incomeLow incomeLower middle incomeLuxembourgMacao SAR, ChinaMacedonia, FYRMadagascarMalawiMalaysiaMaliMaltaMauritaniaMauritiusMexicoMiddle East & North AfricaMiddle East & North Africa (excluding high income)Middle East & North Africa (IDA & IBRD countries)Middle incomeMoldovaMongoliaMontenegroMoroccoMozambiqueNamibiaNepalNetherlandsNew ZealandNicaraguaNigerNigeriaNorth AmericaNorwayOECD membersOmanOther small statesPakistanPanamaPapua New GuineaParaguayPeruPhilippinesPolandPortugalPost-demographic dividendPre-demographic dividendPuerto RicoQatarRomaniaRussian FederationRwandaSaudi ArabiaSenegalSerbiaSeychellesSierra LeoneSingaporeSlovak RepublicSloveniaSmall statesSomaliaSouth AfricaSouth AsiaSouth Asia (IDA & IBRD)South SudanSpainSri LankaSub-Saharan Africa Sub-Saharan Africa (excluding high income)Sub-Saharan Africa (IDA & IBRD countries)SudanSurinameSwazilandSwedenSwitzerlandSyrian Arab RepublicTajikistanTanzaniaThailandTimor-LesteTogoTrinidad and TobagoTunisiaTurkeyTurkmenistanUgandaUkraineUnited Arab EmiratesUnited KingdomUnited StatesUpper middle incomeUruguayUzbekistanVanuatuVenezuela, RBVietnamWest Bank and GazaWorldZimbabwe Timeline:
This timeline shows a graph from 1972 to 2016 of OECD members. No data until 1971. Number of actual observations by date: 45.
Source name:
World Development Indicators
Source organization:
World Bank national accounts data, and OECD National Accounts data files.
Categories, topics:
Economy & Growth
Last updated:
apr 23, 2017
Indicators value changes by year
Minimum:
-0.397
jan 1, 2010
At the date of observation
Value
Absolute change
Change from previous value
jan 1, 1972
4.321
+4.321
0.0%
jan 1, 1973
5.598
+1.277
29.55%
jan 1, 1974
5.174
-0.424
-7.58%
jan 1, 1975
1.51
-3.664
-70.81%
jan 1, 1976
2.51
+1.0
66.19%
jan 1, 1977
4.098
+1.588
63.28%
jan 1, 1978
3.606
-0.491
-11.99%
jan 1, 1979
4.202
+0.595
16.51%
jan 1, 1980
3.617
-0.585
-13.91%
jan 1, 1981
1.556
-2.062
-56.99%
jan 1, 1982
2.222
+0.667
42.85%
jan 1, 1983
1.324
-0.899
-40.44%
jan 1, 1984
3.047
+1.724
130.23%
jan 1, 1985
3.338
+0.291
9.54%
jan 1, 1986
3.754
+0.416
12.48%
jan 1, 1987
3.293
-0.461
-12.29%
jan 1, 1988
3.361
+0.068
2.07%
jan 1, 1989
3.839
+0.478
14.21%
jan 1, 1990
3.394
-0.445
-11.59%
jan 1, 1991
3.017
-0.377
-11.1%
jan 1, 1992
1.686
-1.331
-44.12%
jan 1, 1993
2.428
+0.742
44.02%
jan 1, 1994
1.575
-0.853
-35.12%
jan 1, 1995
2.508
+0.933
59.24%
jan 1, 1996
2.012
-0.496
-19.79%
jan 1, 1997
2.854
+0.843
41.88%
jan 1, 1998
2.773
-0.081
-2.85%
jan 1, 1999
2.884
+0.111
4.01%
jan 1, 2000
3.721
+0.837
29.02%
jan 1, 2001
3.483
-0.238
-6.4%
jan 1, 2002
2.35
-1.133
-32.52%
jan 1, 2003
2.368
+0.018
0.77%
jan 1, 2004
2.193
-0.175
-7.39%
jan 1, 2005
2.753
+0.559
25.5%
jan 1, 2006
2.609
-0.144
-5.23%
jan 1, 2007
2.469
-0.14
-5.36%
jan 1, 2008
2.247
-0.222
-8.98%
jan 1, 2009
0.612
-1.635
-72.75%
jan 1, 2010
-0.397
-1.009
-164.8%
jan 1, 2011
1.787
+2.184
-550.26%
jan 1, 2012
1.025
-0.762
-42.65%
jan 1, 2013
0.833
-0.192
-18.74%
jan 1, 2014
0.885
+0.053
6.31%
jan 1, 2015
1.395
+0.51
57.56%
jan 1, 2016
2.1
+0.705
50.55%
Ranking of countries by current statistics by years


Comments: