29
/
en
AIzaSyAYiBZKx7MnpbEhh9jyipgxe19OcubqV5w
April 1, 2024
159370
Ireland
IRL
true
2
1
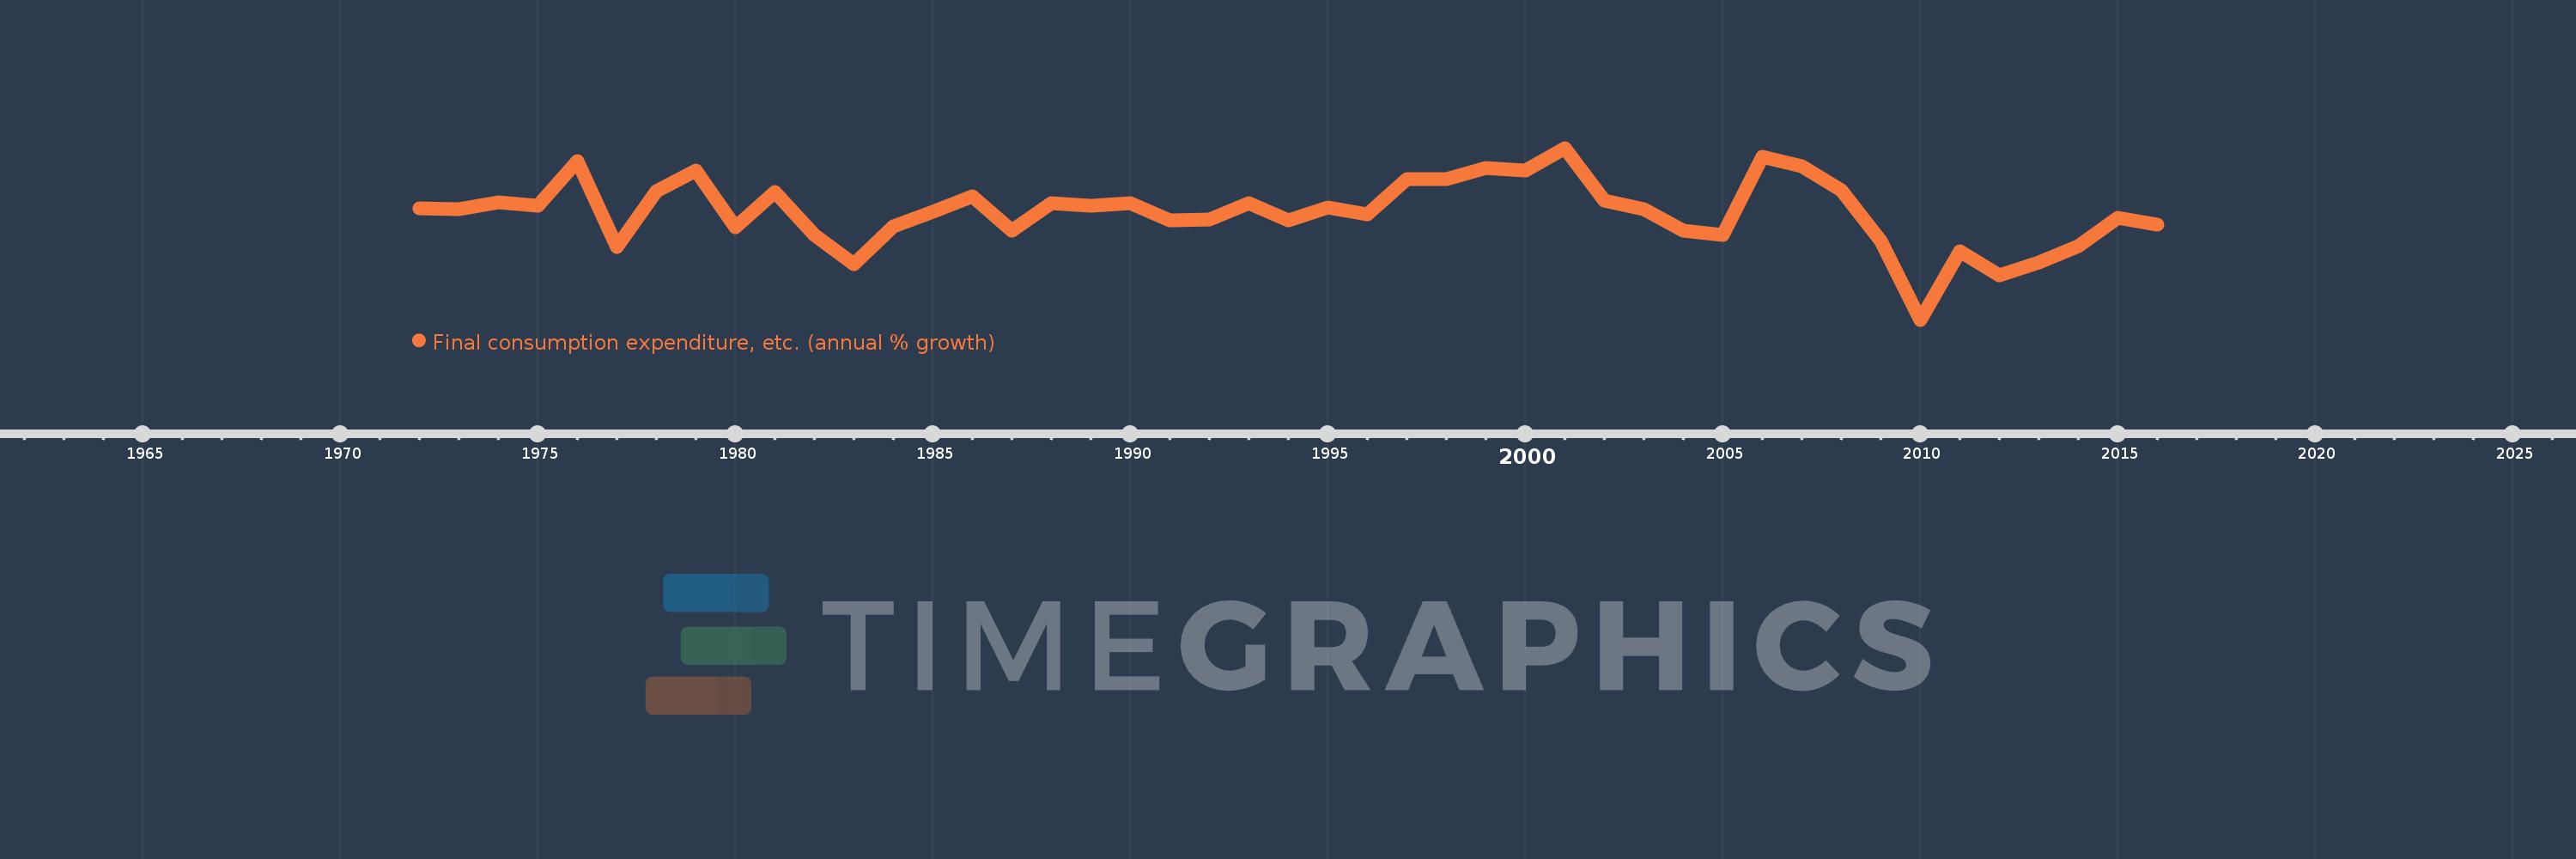
Final consumption expenditure, etc. (annual % growth)
2016,2015,2014,2013,2012,2011,2010,2009,2008,2007,2006,2005,2004,2003,2002,2001,2000,1999,1998,1997,1996,1995,1994,1993,1992,1991,1990,1989,1988,1987,1986,1985,1984,1983,1982,1981,1980,1979,1978,1977,1976,1975,1974,1973,1972
This statistics in other country:
AlbaniaAlgeriaAntigua and BarbudaArab WorldArgentinaArmeniaAustraliaAustriaAzerbaijanBahamas, TheBahrainBangladeshBarbadosBelarusBelgiumBelizeBeninBhutanBoliviaBosnia and HerzegovinaBotswanaBrazilBrunei DarussalamBulgariaBurkina FasoBurundiCabo VerdeCambodiaCameroonCanadaCaribbean small statesCentral Europe and the BalticsChadChileColombiaComorosCongo, Dem. Rep.Congo, Rep.Costa RicaCote d'IvoireCroatiaCubaCyprusCzech RepublicDenmarkDjiboutiDominican RepublicEarly-demographic dividendEast Asia & PacificEcuadorEgypt, Arab Rep.El SalvadorEquatorial GuineaEritreaEstoniaEthiopiaEuro areaEurope & Central AsiaEurope & Central Asia (excluding high income)Europe & Central Asia (IDA & IBRD countries)European UnionFijiFinlandFranceGabonGambia, TheGeorgiaGermanyGhanaGreeceGuatemalaGuineaGuinea-BissauHaitiHeavily indebted poor countries (HIPC)High incomeHondurasHong Kong SAR, ChinaHungaryIBRD onlyIcelandIDA & IBRD totalIDA blendIDA onlyIDA totalIndiaIndonesiaIran, Islamic Rep.IrelandIsraelItalyJamaicaJapanJordanKazakhstanKenyaKorea, Rep.KosovoKuwaitKyrgyz RepublicLao PDRLatin America & Caribbean Latin America & Caribbean (excluding high income)Latin America & the Caribbean (IDA & IBRD countries)LatviaLeast developed countries: UN classificationLebanonLiberiaLithuaniaLow & middle incomeLow incomeLower middle incomeLuxembourgMacao SAR, ChinaMacedonia, FYRMadagascarMalawiMalaysiaMaliMaltaMauritaniaMauritiusMexicoMiddle East & North AfricaMiddle East & North Africa (excluding high income)Middle East & North Africa (IDA & IBRD countries)Middle incomeMoldovaMongoliaMontenegroMoroccoMozambiqueNamibiaNepalNetherlandsNew ZealandNicaraguaNigerNigeriaNorth AmericaNorwayOECD membersOmanOther small statesPakistanPanamaPapua New GuineaParaguayPeruPhilippinesPolandPortugalPost-demographic dividendPre-demographic dividendPuerto RicoQatarRomaniaRussian FederationRwandaSaudi ArabiaSenegalSerbiaSeychellesSierra LeoneSingaporeSlovak RepublicSloveniaSmall statesSomaliaSouth AfricaSouth AsiaSouth Asia (IDA & IBRD)South SudanSpainSri LankaSub-Saharan Africa Sub-Saharan Africa (excluding high income)Sub-Saharan Africa (IDA & IBRD countries)SudanSurinameSwazilandSwedenSwitzerlandSyrian Arab RepublicTajikistanTanzaniaThailandTimor-LesteTogoTrinidad and TobagoTunisiaTurkeyTurkmenistanUgandaUkraineUnited Arab EmiratesUnited KingdomUnited StatesUpper middle incomeUruguayUzbekistanVanuatuVenezuela, RBVietnamWest Bank and GazaWorldZimbabwe Timeline:
This timeline shows a graph from 1972 to 2016 of Ireland. No data until 1971. Number of actual observations by date: 45.
Source name:
World Development Indicators
Source organization:
World Bank national accounts data, and OECD National Accounts data files.
Categories, topics:
Economy & Growth
Last updated:
apr 23, 2017
Indicators value changes by year
Minimum:
-7.912
jan 1, 2010
Maximum:
10.506
jan 1, 2001
At the date of observation
Value
Absolute change
Change from previous value
jan 1, 1972
4.055
+4.055
0.0%
jan 1, 1973
3.976
-0.08
-1.96%
jan 1, 1974
4.666
+0.69
17.36%
jan 1, 1975
4.285
-0.381
-8.16%
jan 1, 1976
9.091
+4.806
112.14%
jan 1, 1977
-0.103
-9.194
-101.13%
jan 1, 1978
5.897
+6.0
-5.82K%
jan 1, 1979
8.059
+2.162
36.66%
jan 1, 1980
2.038
-6.022
-74.72%
jan 1, 1981
5.74
+3.703
181.7%
jan 1, 1982
1.196
-4.545
-79.17%
jan 1, 1983
-1.986
-3.182
-266.15%
jan 1, 1984
2.11
+4.097
-206.24%
jan 1, 1985
3.623
+1.513
71.67%
jan 1, 1986
5.32
+1.697
46.83%
jan 1, 1987
1.595
-3.724
-70.01%
jan 1, 1988
4.623
+3.028
189.8%
jan 1, 1989
4.28
-0.343
-7.42%
jan 1, 1990
4.579
+0.299
6.99%
jan 1, 1991
2.734
-1.845
-40.29%
jan 1, 1992
2.793
+0.058
2.13%
jan 1, 1993
4.578
+1.786
63.94%
jan 1, 1994
2.787
-1.791
-39.13%
jan 1, 1995
4.08
+1.293
46.39%
jan 1, 1996
3.424
-0.656
-16.08%
jan 1, 1997
7.161
+3.737
109.15%
jan 1, 1998
7.118
-0.043
-0.6%
jan 1, 1999
8.34
+1.222
17.18%
jan 1, 2000
8.103
-0.237
-2.84%
jan 1, 2001
10.506
+2.403
29.65%
jan 1, 2002
4.857
-5.649
-53.77%
jan 1, 2003
3.917
-0.94
-19.35%
jan 1, 2004
1.643
-2.273
-58.04%
jan 1, 2005
1.144
-0.499
-30.37%
jan 1, 2006
9.581
+8.437
737.3%
jan 1, 2007
8.551
-1.03
-10.75%
jan 1, 2008
5.925
-2.627
-30.72%
jan 1, 2009
0.526
-5.398
-91.11%
jan 1, 2010
-7.912
-8.439
-1.6K%
jan 1, 2011
-0.561
+7.351
-92.91%
jan 1, 2012
-3.106
-2.545
453.91%
jan 1, 2013
-1.762
+1.344
-43.27%
jan 1, 2014
-0.004
+1.759
-99.8%
jan 1, 2015
3.025
+3.029
-86.36K%
jan 1, 2016
2.268
-0.757
-25.02%
Ranking of countries by current statistics by years


Comments: