29
/
en
AIzaSyAYiBZKx7MnpbEhh9jyipgxe19OcubqV5w
April 1, 2024
280932
Venezuela, RB
VEN
true
2
1
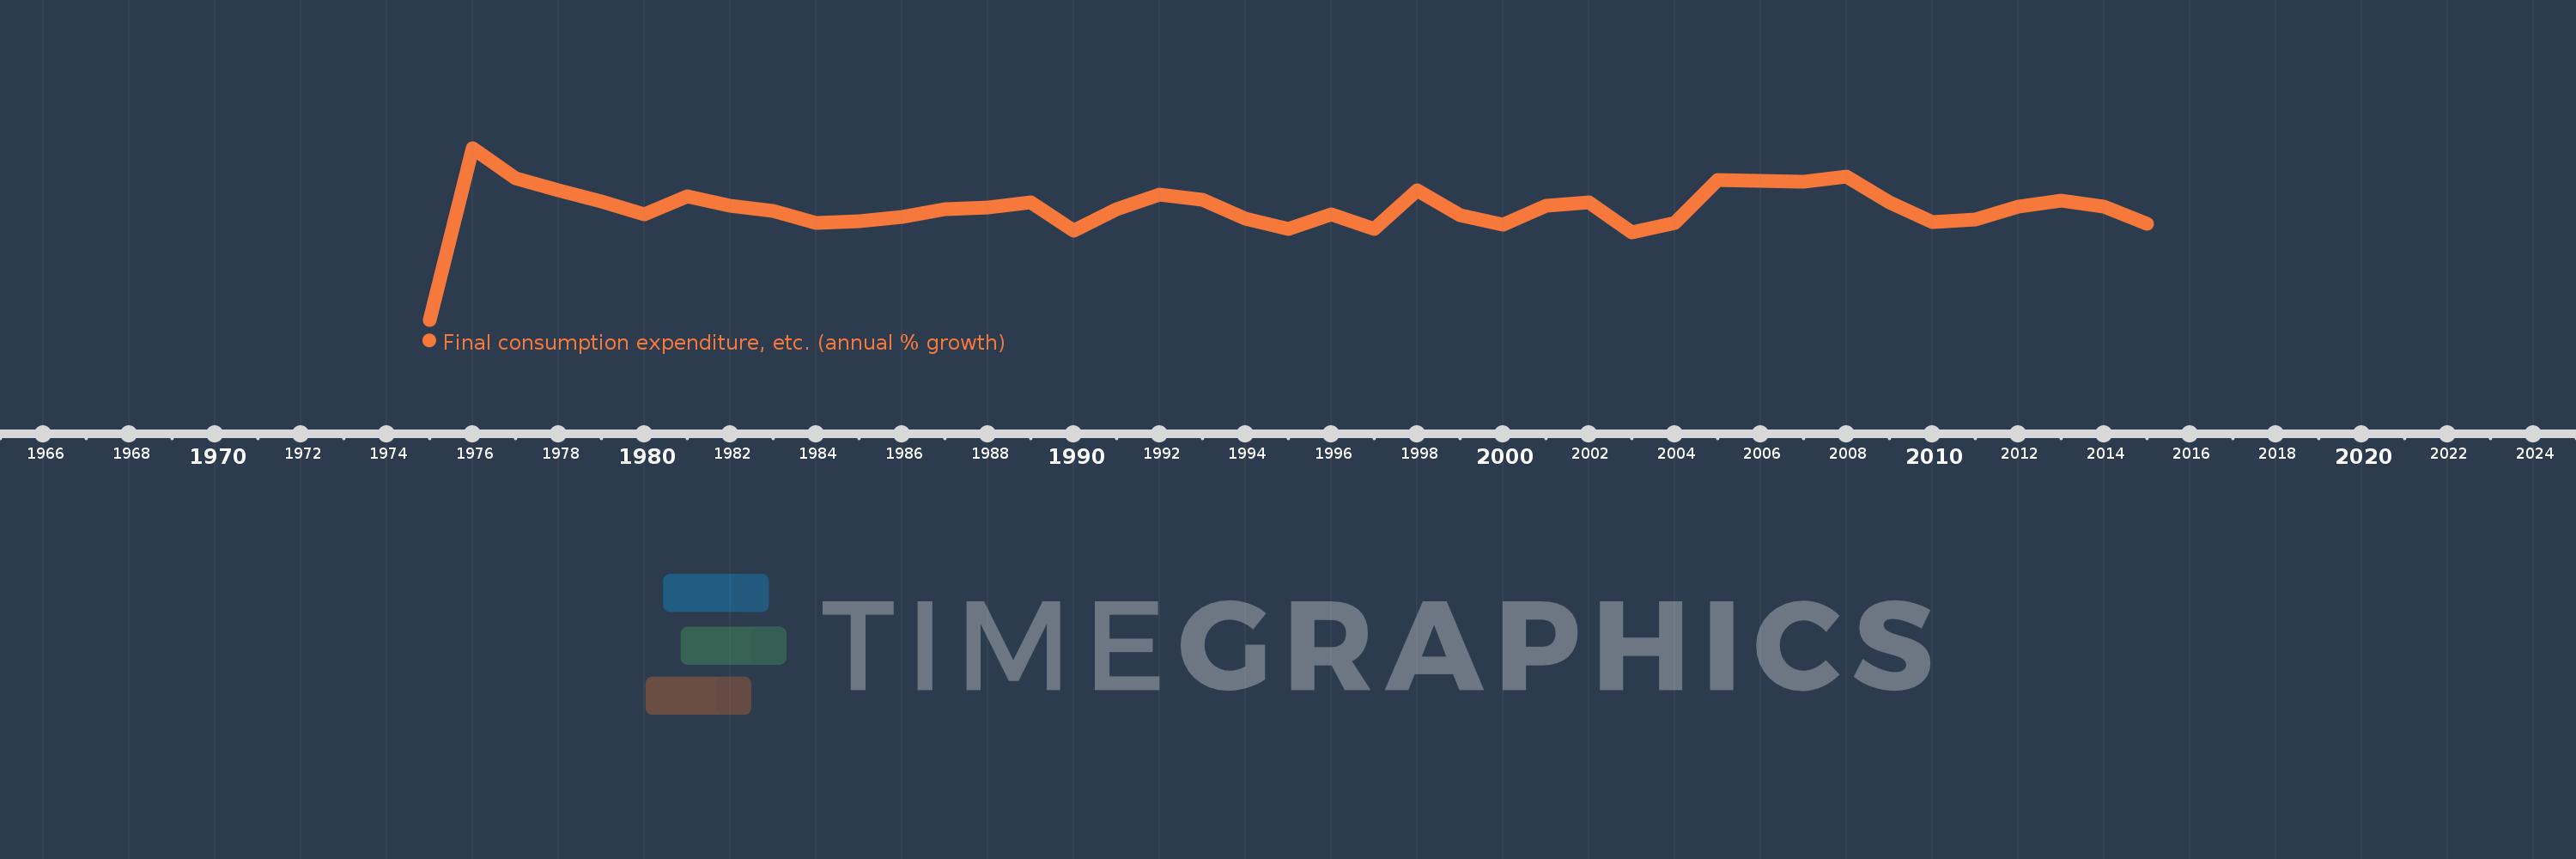
Final consumption expenditure, etc. (annual % growth)
2015,2014,2013,2012,2011,2010,2009,2008,2007,2006,2005,2004,2003,2002,2001,2000,1999,1998,1997,1996,1995,1994,1993,1992,1991,1990,1989,1988,1987,1986,1985,1984,1983,1982,1981,1980,1979,1978,1977,1976,1975
This statistics in other country:
AlbaniaAlgeriaAntigua and BarbudaArab WorldArgentinaArmeniaAustraliaAustriaAzerbaijanBahamas, TheBahrainBangladeshBarbadosBelarusBelgiumBelizeBeninBhutanBoliviaBosnia and HerzegovinaBotswanaBrazilBrunei DarussalamBulgariaBurkina FasoBurundiCabo VerdeCambodiaCameroonCanadaCaribbean small statesCentral Europe and the BalticsChadChileColombiaComorosCongo, Dem. Rep.Congo, Rep.Costa RicaCote d'IvoireCroatiaCubaCyprusCzech RepublicDenmarkDjiboutiDominican RepublicEarly-demographic dividendEast Asia & PacificEcuadorEgypt, Arab Rep.El SalvadorEquatorial GuineaEritreaEstoniaEthiopiaEuro areaEurope & Central AsiaEurope & Central Asia (excluding high income)Europe & Central Asia (IDA & IBRD countries)European UnionFijiFinlandFranceGabonGambia, TheGeorgiaGermanyGhanaGreeceGuatemalaGuineaGuinea-BissauHaitiHeavily indebted poor countries (HIPC)High incomeHondurasHong Kong SAR, ChinaHungaryIBRD onlyIcelandIDA & IBRD totalIDA blendIDA onlyIDA totalIndiaIndonesiaIran, Islamic Rep.IrelandIsraelItalyJamaicaJapanJordanKazakhstanKenyaKorea, Rep.KosovoKuwaitKyrgyz RepublicLao PDRLatin America & Caribbean Latin America & Caribbean (excluding high income)Latin America & the Caribbean (IDA & IBRD countries)LatviaLeast developed countries: UN classificationLebanonLiberiaLithuaniaLow & middle incomeLow incomeLower middle incomeLuxembourgMacao SAR, ChinaMacedonia, FYRMadagascarMalawiMalaysiaMaliMaltaMauritaniaMauritiusMexicoMiddle East & North AfricaMiddle East & North Africa (excluding high income)Middle East & North Africa (IDA & IBRD countries)Middle incomeMoldovaMongoliaMontenegroMoroccoMozambiqueNamibiaNepalNetherlandsNew ZealandNicaraguaNigerNigeriaNorth AmericaNorwayOECD membersOmanOther small statesPakistanPanamaPapua New GuineaParaguayPeruPhilippinesPolandPortugalPost-demographic dividendPre-demographic dividendPuerto RicoQatarRomaniaRussian FederationRwandaSaudi ArabiaSenegalSerbiaSeychellesSierra LeoneSingaporeSlovak RepublicSloveniaSmall statesSomaliaSouth AfricaSouth AsiaSouth Asia (IDA & IBRD)South SudanSpainSri LankaSub-Saharan Africa Sub-Saharan Africa (excluding high income)Sub-Saharan Africa (IDA & IBRD countries)SudanSurinameSwazilandSwedenSwitzerlandSyrian Arab RepublicTajikistanTanzaniaThailandTimor-LesteTogoTrinidad and TobagoTunisiaTurkeyTurkmenistanUgandaUkraineUnited Arab EmiratesUnited KingdomUnited StatesUpper middle incomeUruguayUzbekistanVanuatuVenezuela, RBVietnamWest Bank and GazaWorldZimbabwe Timeline:
This timeline shows a graph from 1975 to 2015 of Venezuela, RB. No data until 1974. Number of actual observations by date: 41.
Source name:
World Development Indicators
Source organization:
World Bank national accounts data, and OECD National Accounts data files.
Categories, topics:
Economy & Growth
Last updated:
apr 23, 2017
Indicators value changes by year
Minimum:
-41.379
jan 1, 1975
Maximum:
27.947
jan 1, 1976
At the date of observation
Value
Absolute change
Change from previous value
jan 1, 1975
-41.379
-41.379
0.0%
jan 1, 1976
27.947
+69.326
-167.54%
jan 1, 1977
15.58
-12.367
-44.25%
jan 1, 1978
11.017
-4.563
-29.29%
jan 1, 1979
6.414
-4.603
-41.78%
jan 1, 1980
1.251
-5.163
-80.5%
jan 1, 1981
8.349
+7.098
567.41%
jan 1, 1982
4.768
-3.58
-42.89%
jan 1, 1983
2.639
-2.13
-44.67%
jan 1, 1984
-2.249
-4.888
-185.25%
jan 1, 1985
-1.5
+0.75
-33.33%
jan 1, 1986
-0.005
+1.494
-99.64%
jan 1, 1987
3.308
+3.313
-62.04K%
jan 1, 1988
3.902
+0.595
17.97%
jan 1, 1989
5.9
+1.998
51.21%
jan 1, 1990
-5.399
-11.3
-191.51%
jan 1, 1991
3.205
+8.604
-159.35%
jan 1, 1992
9.119
+5.914
184.56%
jan 1, 1993
6.883
-2.236
-24.52%
jan 1, 1994
-0.731
-7.614
-110.62%
jan 1, 1995
-4.666
-3.935
538.32%
jan 1, 1996
1.183
+5.849
-125.35%
jan 1, 1997
-4.879
-6.062
-512.39%
jan 1, 1998
10.785
+15.664
-321.06%
jan 1, 1999
0.82
-9.965
-92.4%
jan 1, 2000
-2.866
-3.685
-449.66%
jan 1, 2001
4.591
+7.457
-260.2%
jan 1, 2002
6.171
+1.58
34.42%
jan 1, 2003
-6.229
-12.4
-200.93%
jan 1, 2004
-2.283
+3.946
-63.34%
jan 1, 2005
15.185
+17.468
-765.06%
jan 1, 2006
14.705
-0.48
-3.16%
jan 1, 2007
14.186
-0.519
-3.53%
jan 1, 2008
16.268
+2.082
14.68%
jan 1, 2009
6.019
-10.249
-63.0%
jan 1, 2010
-2.072
-8.091
-134.42%
jan 1, 2011
-1.074
+0.998
-48.16%
jan 1, 2012
4.411
+5.485
-510.71%
jan 1, 2013
6.865
+2.454
55.63%
jan 1, 2014
4.438
-2.427
-35.35%
jan 1, 2015
-2.546
-6.984
-157.37%
Ranking of countries by current statistics by years


Comments: