29
/
en
AIzaSyAYiBZKx7MnpbEhh9jyipgxe19OcubqV5w
April 1, 2024
269286
Turkey
TUR
true
2
1
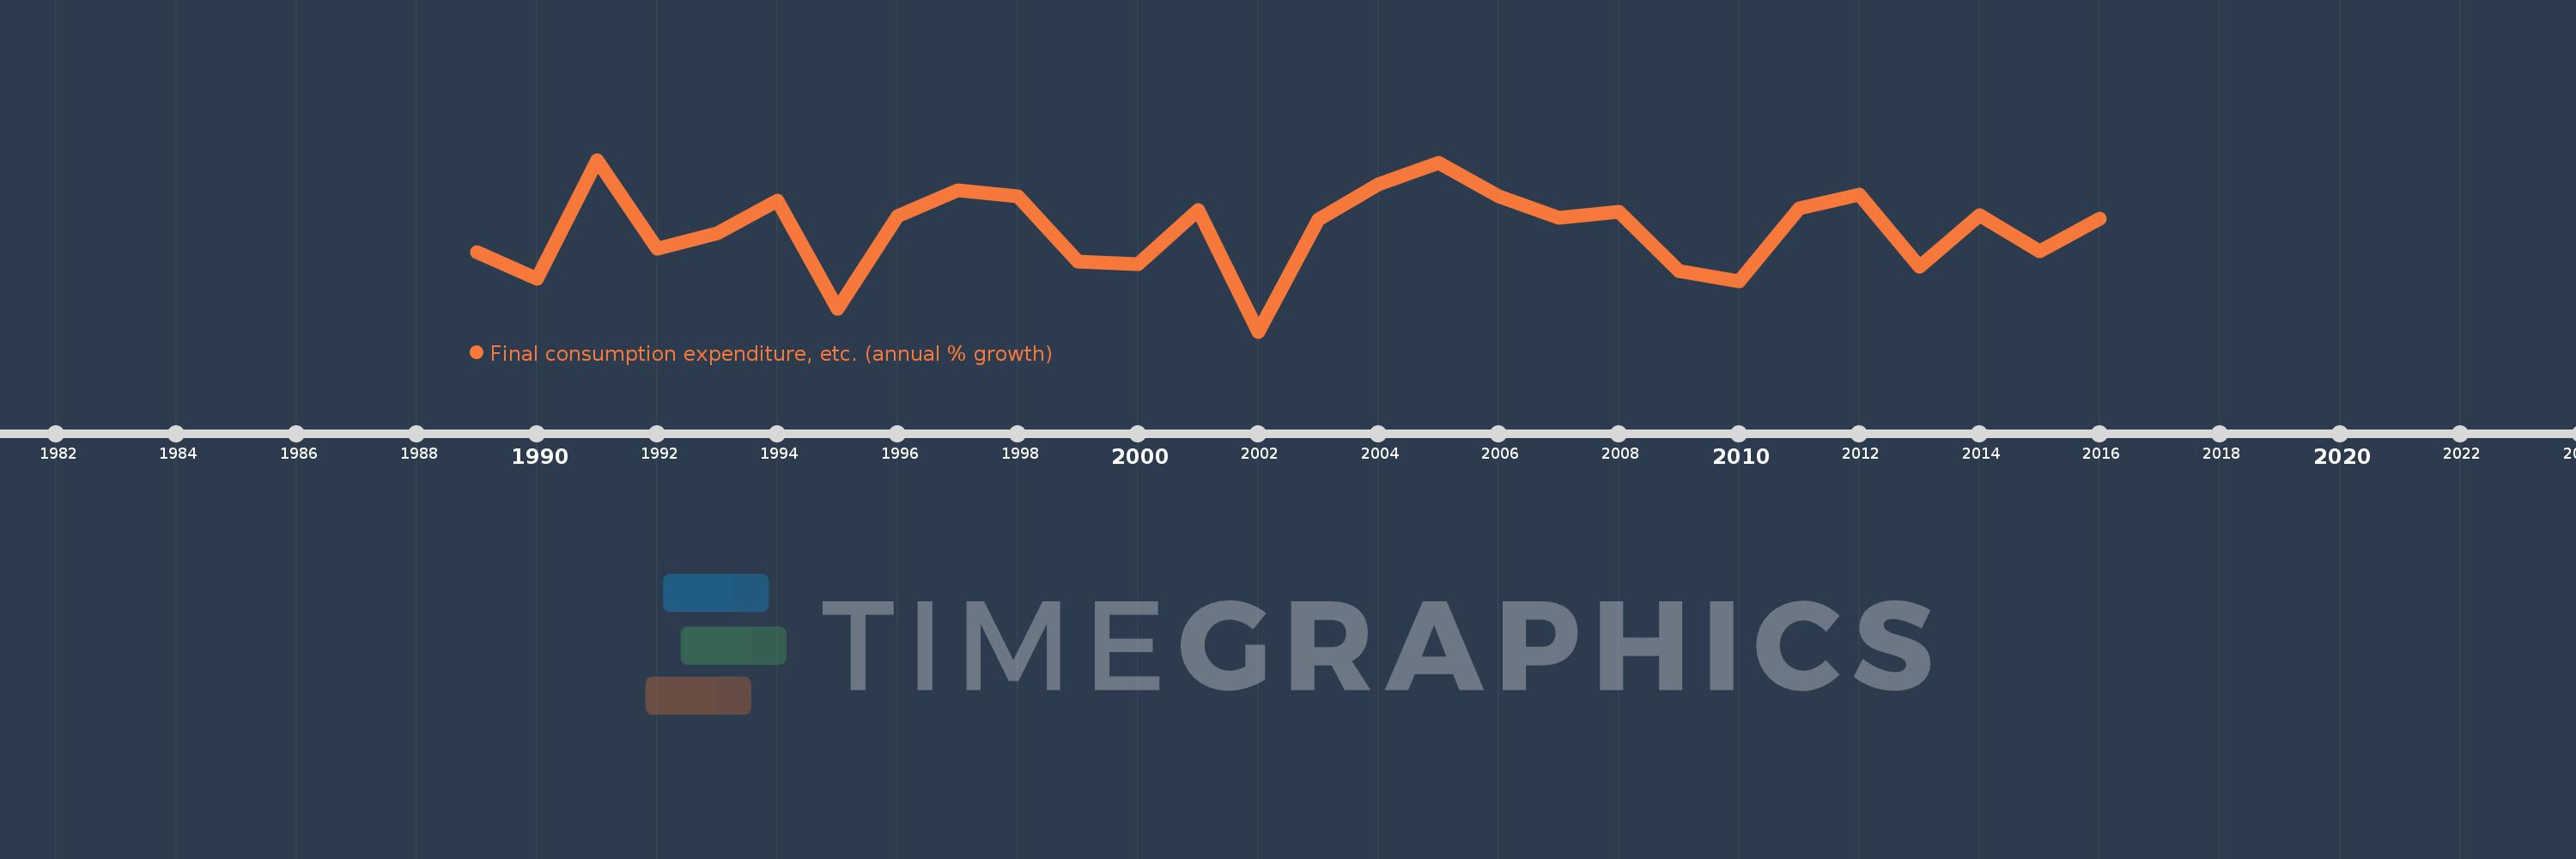
Final consumption expenditure, etc. (annual % growth)
2016,2015,2014,2013,2012,2011,2010,2009,2008,2007,2006,2005,2004,2003,2002,2001,2000,1999,1998,1997,1996,1995,1994,1993,1992,1991,1990,1989
This statistics in other country:
AlbaniaAlgeriaAntigua and BarbudaArab WorldArgentinaArmeniaAustraliaAustriaAzerbaijanBahamas, TheBahrainBangladeshBarbadosBelarusBelgiumBelizeBeninBhutanBoliviaBosnia and HerzegovinaBotswanaBrazilBrunei DarussalamBulgariaBurkina FasoBurundiCabo VerdeCambodiaCameroonCanadaCaribbean small statesCentral Europe and the BalticsChadChileColombiaComorosCongo, Dem. Rep.Congo, Rep.Costa RicaCote d'IvoireCroatiaCubaCyprusCzech RepublicDenmarkDjiboutiDominican RepublicEarly-demographic dividendEast Asia & PacificEcuadorEgypt, Arab Rep.El SalvadorEquatorial GuineaEritreaEstoniaEthiopiaEuro areaEurope & Central AsiaEurope & Central Asia (excluding high income)Europe & Central Asia (IDA & IBRD countries)European UnionFijiFinlandFranceGabonGambia, TheGeorgiaGermanyGhanaGreeceGuatemalaGuineaGuinea-BissauHaitiHeavily indebted poor countries (HIPC)High incomeHondurasHong Kong SAR, ChinaHungaryIBRD onlyIcelandIDA & IBRD totalIDA blendIDA onlyIDA totalIndiaIndonesiaIran, Islamic Rep.IrelandIsraelItalyJamaicaJapanJordanKazakhstanKenyaKorea, Rep.KosovoKuwaitKyrgyz RepublicLao PDRLatin America & Caribbean Latin America & Caribbean (excluding high income)Latin America & the Caribbean (IDA & IBRD countries)LatviaLeast developed countries: UN classificationLebanonLiberiaLithuaniaLow & middle incomeLow incomeLower middle incomeLuxembourgMacao SAR, ChinaMacedonia, FYRMadagascarMalawiMalaysiaMaliMaltaMauritaniaMauritiusMexicoMiddle East & North AfricaMiddle East & North Africa (excluding high income)Middle East & North Africa (IDA & IBRD countries)Middle incomeMoldovaMongoliaMontenegroMoroccoMozambiqueNamibiaNepalNetherlandsNew ZealandNicaraguaNigerNigeriaNorth AmericaNorwayOECD membersOmanOther small statesPakistanPanamaPapua New GuineaParaguayPeruPhilippinesPolandPortugalPost-demographic dividendPre-demographic dividendPuerto RicoQatarRomaniaRussian FederationRwandaSaudi ArabiaSenegalSerbiaSeychellesSierra LeoneSingaporeSlovak RepublicSloveniaSmall statesSomaliaSouth AfricaSouth AsiaSouth Asia (IDA & IBRD)South SudanSpainSri LankaSub-Saharan Africa Sub-Saharan Africa (excluding high income)Sub-Saharan Africa (IDA & IBRD countries)SudanSurinameSwazilandSwedenSwitzerlandSyrian Arab RepublicTajikistanTanzaniaThailandTimor-LesteTogoTrinidad and TobagoTunisiaTurkeyTurkmenistanUgandaUkraineUnited Arab EmiratesUnited KingdomUnited StatesUpper middle incomeUruguayUzbekistanVanuatuVenezuela, RBVietnamWest Bank and GazaWorldZimbabwe Timeline:
This timeline shows a graph from 1989 to 2016 of Turkey. No data until 1988. Number of actual observations by date: 28.
Source name:
World Development Indicators
Source organization:
World Bank national accounts data, and OECD National Accounts data files.
Categories, topics:
Economy & Growth
Last updated:
apr 23, 2017
Indicators value changes by year
Minimum:
-5.833
jan 1, 2002
Maximum:
10.645
jan 1, 1991
At the date of observation
Value
Absolute change
Change from previous value
jan 1, 1989
1.823
+1.823
0.0%
jan 1, 1990
-0.784
-2.607
-142.98%
jan 1, 1991
10.645
+11.429
-1.46K%
jan 1, 1992
2.112
-8.532
-80.16%
jan 1, 1993
3.627
+1.515
71.7%
jan 1, 1994
6.695
+3.068
84.58%
jan 1, 1995
-3.669
-10.364
-154.8%
jan 1, 1996
5.253
+8.922
-243.18%
jan 1, 1997
7.717
+2.465
46.92%
jan 1, 1998
7.134
-0.583
-7.56%
jan 1, 1999
0.911
-6.223
-87.23%
jan 1, 2000
0.61
-0.3
-32.99%
jan 1, 2001
5.831
+5.22
855.14%
jan 1, 2002
-5.833
-11.664
-200.04%
jan 1, 2003
4.9
+10.733
-183.99%
jan 1, 2004
8.308
+3.408
69.56%
jan 1, 2005
10.323
+2.015
24.26%
jan 1, 2006
7.174
-3.149
-30.51%
jan 1, 2007
5.103
-2.071
-28.87%
jan 1, 2008
5.629
+0.526
10.31%
jan 1, 2009
-0.057
-5.686
-101.01%
jan 1, 2010
-0.993
-0.936
1.64K%
jan 1, 2011
6.017
+7.01
-706.08%
jan 1, 2012
7.28
+1.263
20.99%
jan 1, 2013
0.394
-6.886
-94.59%
jan 1, 2014
5.318
+4.924
1.25K%
jan 1, 2015
1.891
-3.426
-64.43%
jan 1, 2016
5.041
+3.15
166.52%
Ranking of countries by current statistics by years


Comments: