29
/
en
AIzaSyAYiBZKx7MnpbEhh9jyipgxe19OcubqV5w
April 1, 2024
69769
Argentina
ARG
true
2
1
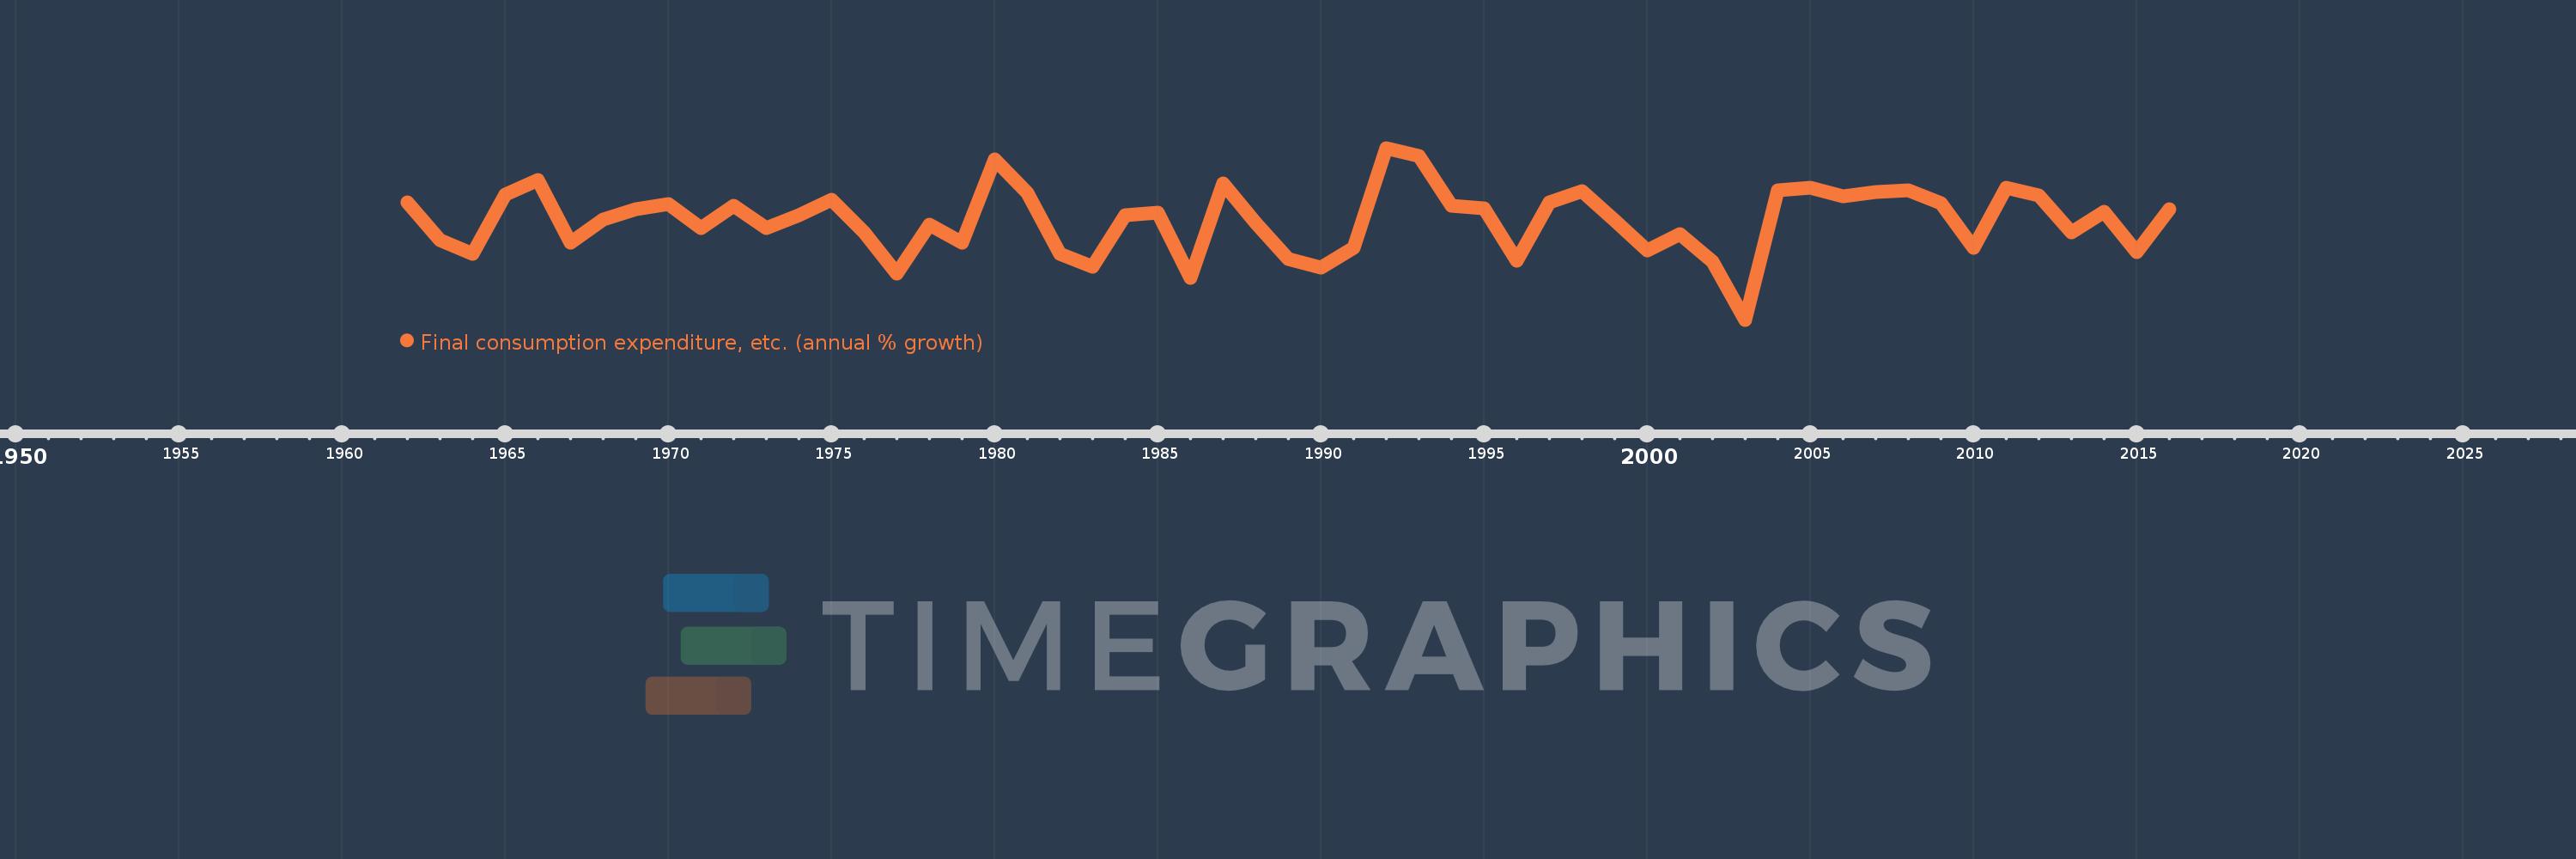
Final consumption expenditure, etc. (annual % growth)
2016,2015,2014,2013,2012,2011,2010,2009,2008,2007,2006,2005,2004,2003,2002,2001,2000,1999,1998,1997,1996,1995,1994,1993,1992,1991,1990,1989,1988,1987,1986,1985,1984,1983,1982,1981,1980,1979,1978,1977,1976,1975,1974,1973,1972,1971,1970,1969,1968,1967,1966,1965,1964,1963,1962
This statistics in other country:
AlbaniaAlgeriaAntigua and BarbudaArab WorldArgentinaArmeniaAustraliaAustriaAzerbaijanBahamas, TheBahrainBangladeshBarbadosBelarusBelgiumBelizeBeninBhutanBoliviaBosnia and HerzegovinaBotswanaBrazilBrunei DarussalamBulgariaBurkina FasoBurundiCabo VerdeCambodiaCameroonCanadaCaribbean small statesCentral Europe and the BalticsChadChileColombiaComorosCongo, Dem. Rep.Congo, Rep.Costa RicaCote d'IvoireCroatiaCubaCyprusCzech RepublicDenmarkDjiboutiDominican RepublicEarly-demographic dividendEast Asia & PacificEcuadorEgypt, Arab Rep.El SalvadorEquatorial GuineaEritreaEstoniaEthiopiaEuro areaEurope & Central AsiaEurope & Central Asia (excluding high income)Europe & Central Asia (IDA & IBRD countries)European UnionFijiFinlandFranceGabonGambia, TheGeorgiaGermanyGhanaGreeceGuatemalaGuineaGuinea-BissauHaitiHeavily indebted poor countries (HIPC)High incomeHondurasHong Kong SAR, ChinaHungaryIBRD onlyIcelandIDA & IBRD totalIDA blendIDA onlyIDA totalIndiaIndonesiaIran, Islamic Rep.IrelandIsraelItalyJamaicaJapanJordanKazakhstanKenyaKorea, Rep.KosovoKuwaitKyrgyz RepublicLao PDRLatin America & Caribbean Latin America & Caribbean (excluding high income)Latin America & the Caribbean (IDA & IBRD countries)LatviaLeast developed countries: UN classificationLebanonLiberiaLithuaniaLow & middle incomeLow incomeLower middle incomeLuxembourgMacao SAR, ChinaMacedonia, FYRMadagascarMalawiMalaysiaMaliMaltaMauritaniaMauritiusMexicoMiddle East & North AfricaMiddle East & North Africa (excluding high income)Middle East & North Africa (IDA & IBRD countries)Middle incomeMoldovaMongoliaMontenegroMoroccoMozambiqueNamibiaNepalNetherlandsNew ZealandNicaraguaNigerNigeriaNorth AmericaNorwayOECD membersOmanOther small statesPakistanPanamaPapua New GuineaParaguayPeruPhilippinesPolandPortugalPost-demographic dividendPre-demographic dividendPuerto RicoQatarRomaniaRussian FederationRwandaSaudi ArabiaSenegalSerbiaSeychellesSierra LeoneSingaporeSlovak RepublicSloveniaSmall statesSomaliaSouth AfricaSouth AsiaSouth Asia (IDA & IBRD)South SudanSpainSri LankaSub-Saharan Africa Sub-Saharan Africa (excluding high income)Sub-Saharan Africa (IDA & IBRD countries)SudanSurinameSwazilandSwedenSwitzerlandSyrian Arab RepublicTajikistanTanzaniaThailandTimor-LesteTogoTrinidad and TobagoTunisiaTurkeyTurkmenistanUgandaUkraineUnited Arab EmiratesUnited KingdomUnited StatesUpper middle incomeUruguayUzbekistanVanuatuVenezuela, RBVietnamWest Bank and GazaWorldZimbabwe Timeline:
This timeline shows a graph from 1962 to 2016 of Argentina. No data until 1961. Number of actual observations by date: 55.
Source name:
World Development Indicators
Source organization:
World Bank national accounts data, and OECD National Accounts data files.
Categories, topics:
Economy & Growth
Last updated:
apr 23, 2017
Indicators value changes by year
Minimum:
-18.525
jan 1, 2003
Maximum:
18.479
jan 1, 1992
At the date of observation
Value
Absolute change
Change from previous value
jan 1, 1962
6.713
+6.713
0.0%
jan 1, 1963
-1.346
-8.059
-120.05%
jan 1, 1964
-4.391
-3.045
226.27%
jan 1, 1965
8.503
+12.895
-293.64%
jan 1, 1966
11.541
+3.037
35.72%
jan 1, 1967
-1.96
-13.501
-116.98%
jan 1, 1968
3.073
+5.033
-256.76%
jan 1, 1969
5.256
+2.183
71.05%
jan 1, 1970
6.461
+1.205
22.92%
jan 1, 1971
1.293
-5.168
-79.98%
jan 1, 1972
5.99
+4.697
363.18%
jan 1, 1973
1.248
-4.742
-79.16%
jan 1, 1974
4.025
+2.777
222.45%
jan 1, 1975
7.318
+3.293
81.8%
jan 1, 1976
0.367
-6.951
-94.99%
jan 1, 1977
-8.512
-8.879
-2.42K%
jan 1, 1978
2.032
+10.544
-123.87%
jan 1, 1979
-1.864
-3.896
-191.74%
jan 1, 1980
15.955
+17.82
-955.81%
jan 1, 1981
8.76
-7.195
-45.1%
jan 1, 1982
-4.291
-13.051
-148.98%
jan 1, 1983
-7.197
-2.906
67.71%
jan 1, 1984
3.935
+11.132
-154.68%
jan 1, 1985
4.548
+0.612
15.56%
jan 1, 1986
-9.461
-14.008
-308.03%
jan 1, 1987
10.847
+20.307
-214.65%
jan 1, 1988
2.358
-8.488
-78.26%
jan 1, 1989
-5.484
-7.842
-332.58%
jan 1, 1990
-7.243
-1.759
32.08%
jan 1, 1991
-3.089
+4.155
-57.36%
jan 1, 1992
18.479
+21.568
-698.27%
jan 1, 1993
16.728
-1.751
-9.48%
jan 1, 1994
6.066
-10.662
-63.74%
jan 1, 1995
5.498
-0.568
-9.36%
jan 1, 1996
-5.807
-11.305
-205.61%
jan 1, 1997
6.745
+12.552
-216.15%
jan 1, 1998
9.228
+2.484
36.82%
jan 1, 1999
2.923
-6.306
-68.33%
jan 1, 2000
-3.648
-6.571
-224.83%
jan 1, 2001
-0.059
+3.589
-98.37%
jan 1, 2002
-6.068
-6.009
10.13K%
jan 1, 2003
-18.525
-12.458
205.3%
jan 1, 2004
9.363
+27.889
-150.54%
jan 1, 2005
9.939
+0.575
6.14%
jan 1, 2006
8.15
-1.789
-18.0%
jan 1, 2007
9.071
+0.921
11.3%
jan 1, 2008
9.302
+0.231
2.55%
jan 1, 2009
6.584
-2.719
-29.23%
jan 1, 2010
-3.008
-9.592
-145.69%
jan 1, 2011
9.916
+12.925
-429.65%
jan 1, 2012
8.236
-1.68
-16.95%
jan 1, 2013
0.345
-7.891
-95.81%
jan 1, 2014
4.739
+4.394
1.27K%
jan 1, 2015
-4.021
-8.76
-184.85%
jan 1, 2016
5.29
+9.311
-231.56%
Ranking of countries by current statistics by years


Comments: