29
/
en
AIzaSyAYiBZKx7MnpbEhh9jyipgxe19OcubqV5w
April 1, 2024
248670
Sri Lanka
LKA
true
2
1
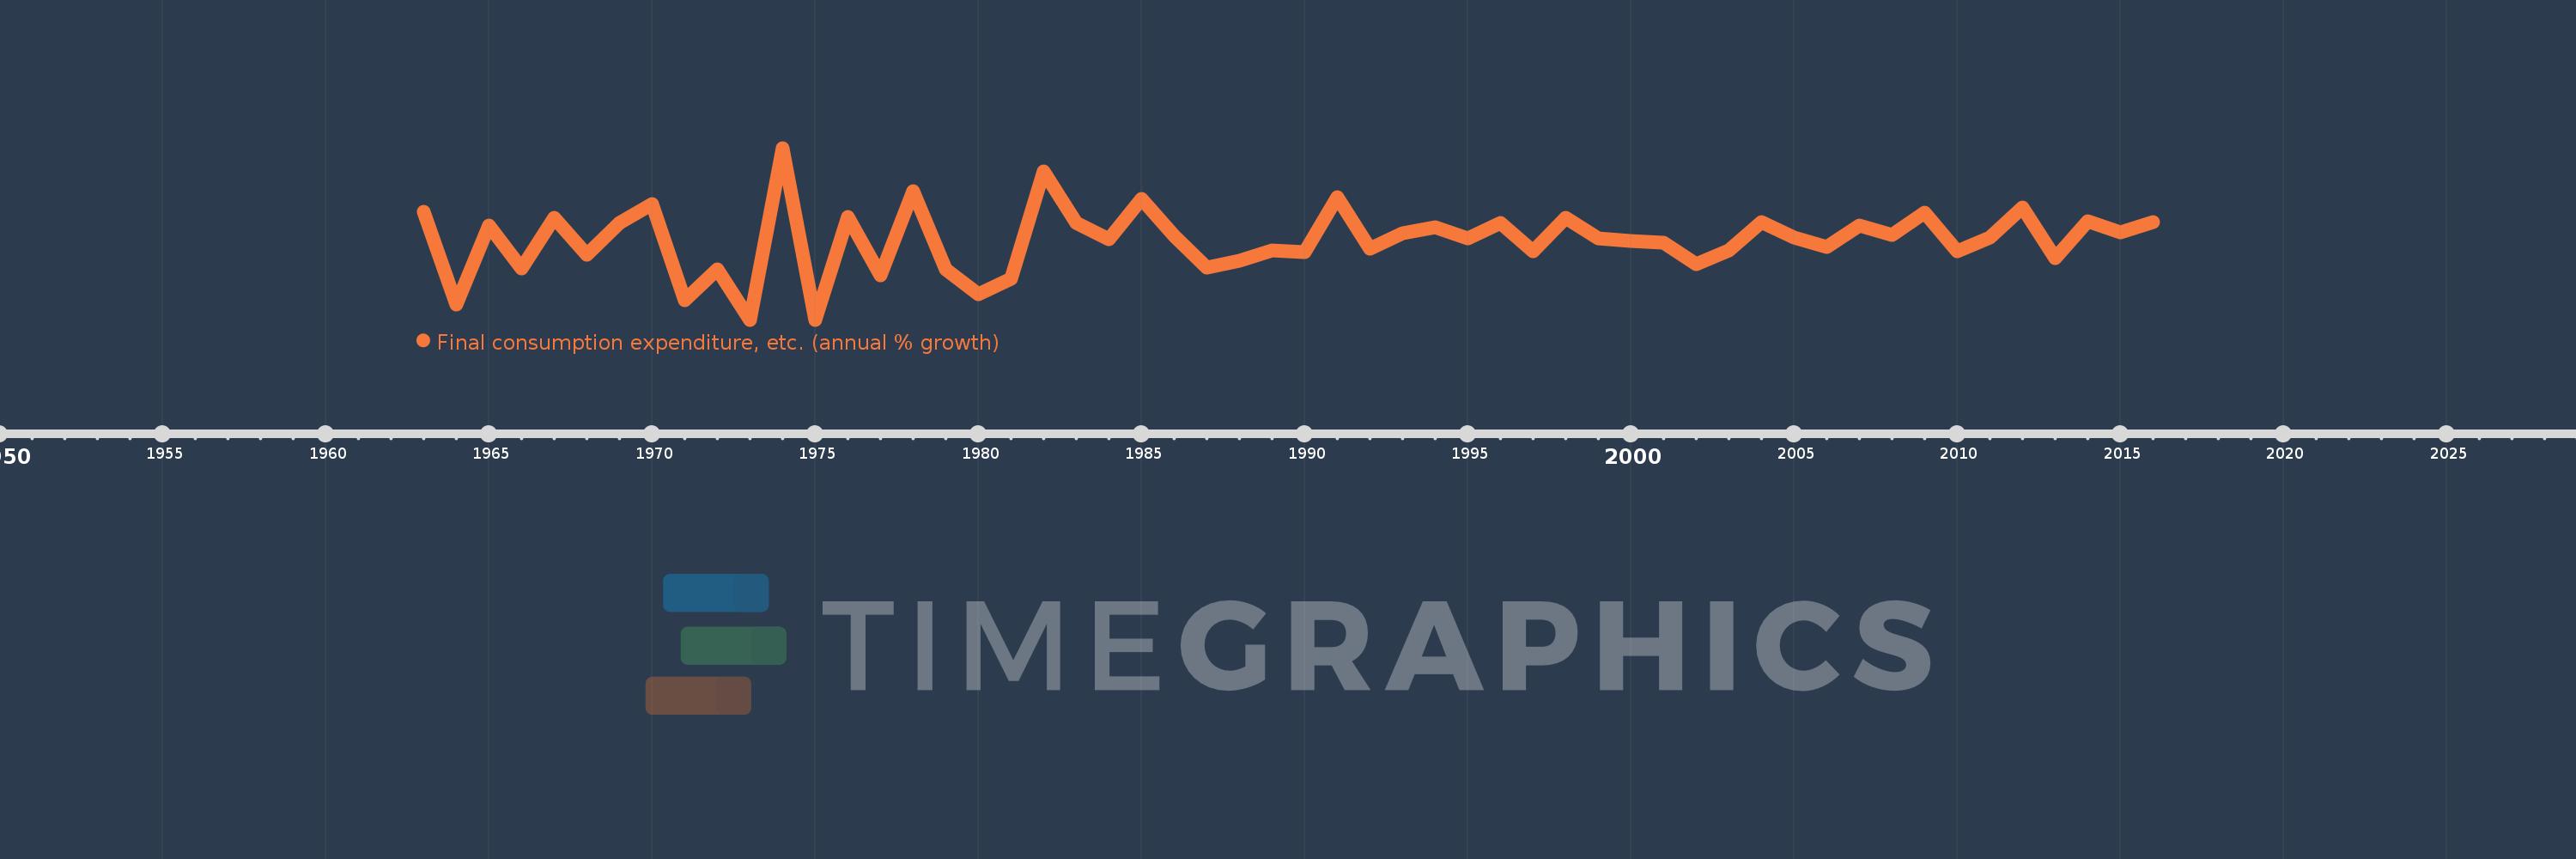
Final consumption expenditure, etc. (annual % growth)
2016,2015,2014,2013,2012,2011,2010,2009,2008,2007,2006,2005,2004,2003,2002,2001,2000,1999,1998,1997,1996,1995,1994,1993,1992,1991,1990,1989,1988,1987,1986,1985,1984,1983,1982,1981,1980,1979,1978,1977,1976,1975,1974,1973,1972,1971,1970,1969,1968,1967,1966,1965,1964,1963
This statistics in other country:
AlbaniaAlgeriaAntigua and BarbudaArab WorldArgentinaArmeniaAustraliaAustriaAzerbaijanBahamas, TheBahrainBangladeshBarbadosBelarusBelgiumBelizeBeninBhutanBoliviaBosnia and HerzegovinaBotswanaBrazilBrunei DarussalamBulgariaBurkina FasoBurundiCabo VerdeCambodiaCameroonCanadaCaribbean small statesCentral Europe and the BalticsChadChileColombiaComorosCongo, Dem. Rep.Congo, Rep.Costa RicaCote d'IvoireCroatiaCubaCyprusCzech RepublicDenmarkDjiboutiDominican RepublicEarly-demographic dividendEast Asia & PacificEcuadorEgypt, Arab Rep.El SalvadorEquatorial GuineaEritreaEstoniaEthiopiaEuro areaEurope & Central AsiaEurope & Central Asia (excluding high income)Europe & Central Asia (IDA & IBRD countries)European UnionFijiFinlandFranceGabonGambia, TheGeorgiaGermanyGhanaGreeceGuatemalaGuineaGuinea-BissauHaitiHeavily indebted poor countries (HIPC)High incomeHondurasHong Kong SAR, ChinaHungaryIBRD onlyIcelandIDA & IBRD totalIDA blendIDA onlyIDA totalIndiaIndonesiaIran, Islamic Rep.IrelandIsraelItalyJamaicaJapanJordanKazakhstanKenyaKorea, Rep.KosovoKuwaitKyrgyz RepublicLao PDRLatin America & Caribbean Latin America & Caribbean (excluding high income)Latin America & the Caribbean (IDA & IBRD countries)LatviaLeast developed countries: UN classificationLebanonLiberiaLithuaniaLow & middle incomeLow incomeLower middle incomeLuxembourgMacao SAR, ChinaMacedonia, FYRMadagascarMalawiMalaysiaMaliMaltaMauritaniaMauritiusMexicoMiddle East & North AfricaMiddle East & North Africa (excluding high income)Middle East & North Africa (IDA & IBRD countries)Middle incomeMoldovaMongoliaMontenegroMoroccoMozambiqueNamibiaNepalNetherlandsNew ZealandNicaraguaNigerNigeriaNorth AmericaNorwayOECD membersOmanOther small statesPakistanPanamaPapua New GuineaParaguayPeruPhilippinesPolandPortugalPost-demographic dividendPre-demographic dividendPuerto RicoQatarRomaniaRussian FederationRwandaSaudi ArabiaSenegalSerbiaSeychellesSierra LeoneSingaporeSlovak RepublicSloveniaSmall statesSomaliaSouth AfricaSouth AsiaSouth Asia (IDA & IBRD)South SudanSpainSri LankaSub-Saharan Africa Sub-Saharan Africa (excluding high income)Sub-Saharan Africa (IDA & IBRD countries)SudanSurinameSwazilandSwedenSwitzerlandSyrian Arab RepublicTajikistanTanzaniaThailandTimor-LesteTogoTrinidad and TobagoTunisiaTurkeyTurkmenistanUgandaUkraineUnited Arab EmiratesUnited KingdomUnited StatesUpper middle incomeUruguayUzbekistanVanuatuVenezuela, RBVietnamWest Bank and GazaWorldZimbabwe Timeline:
This timeline shows a graph from 1963 to 2016 of Sri Lanka. No data until 1962. Number of actual observations by date: 54.
Source name:
World Development Indicators
Source organization:
World Bank national accounts data, and OECD National Accounts data files.
Categories, topics:
Economy & Growth
Last updated:
apr 23, 2017
Indicators value changes by year
Minimum:
-4.563
jan 1, 1975
Maximum:
15.574
jan 1, 1974
At the date of observation
Value
Absolute change
Change from previous value
jan 1, 1963
8.049
+8.049
0.0%
jan 1, 1964
-2.732
-10.781
-133.94%
jan 1, 1965
6.451
+9.183
-336.11%
jan 1, 1966
1.438
-5.012
-77.7%
jan 1, 1967
7.397
+5.958
414.22%
jan 1, 1968
3.01
-4.387
-59.31%
jan 1, 1969
6.749
+3.739
124.23%
jan 1, 1970
9.017
+2.268
33.6%
jan 1, 1971
-2.303
-11.32
-125.54%
jan 1, 1972
1.3
+3.603
-156.48%
jan 1, 1973
-4.543
-5.843
-449.3%
jan 1, 1974
15.574
+20.116
-442.84%
jan 1, 1975
-4.563
-20.137
-129.3%
jan 1, 1976
7.47
+12.033
-263.71%
jan 1, 1977
0.64
-6.83
-91.43%
jan 1, 1978
10.537
+9.896
1.55K%
jan 1, 1979
1.328
-9.209
-87.4%
jan 1, 1980
-1.606
-2.934
-220.94%
jan 1, 1981
0.195
+1.801
-112.14%
jan 1, 1982
12.84
+12.645
6.49K%
jan 1, 1983
6.759
-6.081
-47.36%
jan 1, 1984
4.909
-1.85
-27.37%
jan 1, 1985
9.625
+4.717
96.08%
jan 1, 1986
5.281
-4.345
-45.14%
jan 1, 1987
1.576
-3.704
-70.15%
jan 1, 1988
2.337
+0.76
48.25%
jan 1, 1989
3.525
+1.188
50.85%
jan 1, 1990
3.388
-0.137
-3.89%
jan 1, 1991
9.798
+6.411
189.23%
jan 1, 1992
3.769
-6.029
-61.53%
jan 1, 1993
5.553
+1.784
47.33%
jan 1, 1994
6.321
+0.768
13.84%
jan 1, 1995
5.005
-1.316
-20.81%
jan 1, 1996
6.819
+1.813
36.23%
jan 1, 1997
3.427
-3.392
-49.74%
jan 1, 1998
7.422
+3.995
116.58%
jan 1, 1999
5.001
-2.421
-32.62%
jan 1, 2000
4.672
-0.329
-6.59%
jan 1, 2001
4.423
-0.249
-5.33%
jan 1, 2002
1.95
-2.473
-55.91%
jan 1, 2003
3.519
+1.57
80.49%
jan 1, 2004
6.897
+3.377
95.96%
jan 1, 2005
5.096
-1.801
-26.11%
jan 1, 2006
3.92
-1.177
-23.09%
jan 1, 2007
6.473
+2.553
65.14%
jan 1, 2008
5.421
-1.052
-16.25%
jan 1, 2009
8.01
+2.589
47.76%
jan 1, 2010
3.448
-4.563
-56.96%
jan 1, 2011
5.079
+1.632
47.33%
jan 1, 2012
8.574
+3.494
68.8%
jan 1, 2013
2.627
-5.947
-69.36%
jan 1, 2014
7.006
+4.378
166.65%
jan 1, 2015
5.704
-1.301
-18.57%
jan 1, 2016
6.904
+1.2
21.04%
Ranking of countries by current statistics by years


Comments: