29
/
en
AIzaSyAYiBZKx7MnpbEhh9jyipgxe19OcubqV5w
April 1, 2024
240420
Singapore
SGP
true
2
1
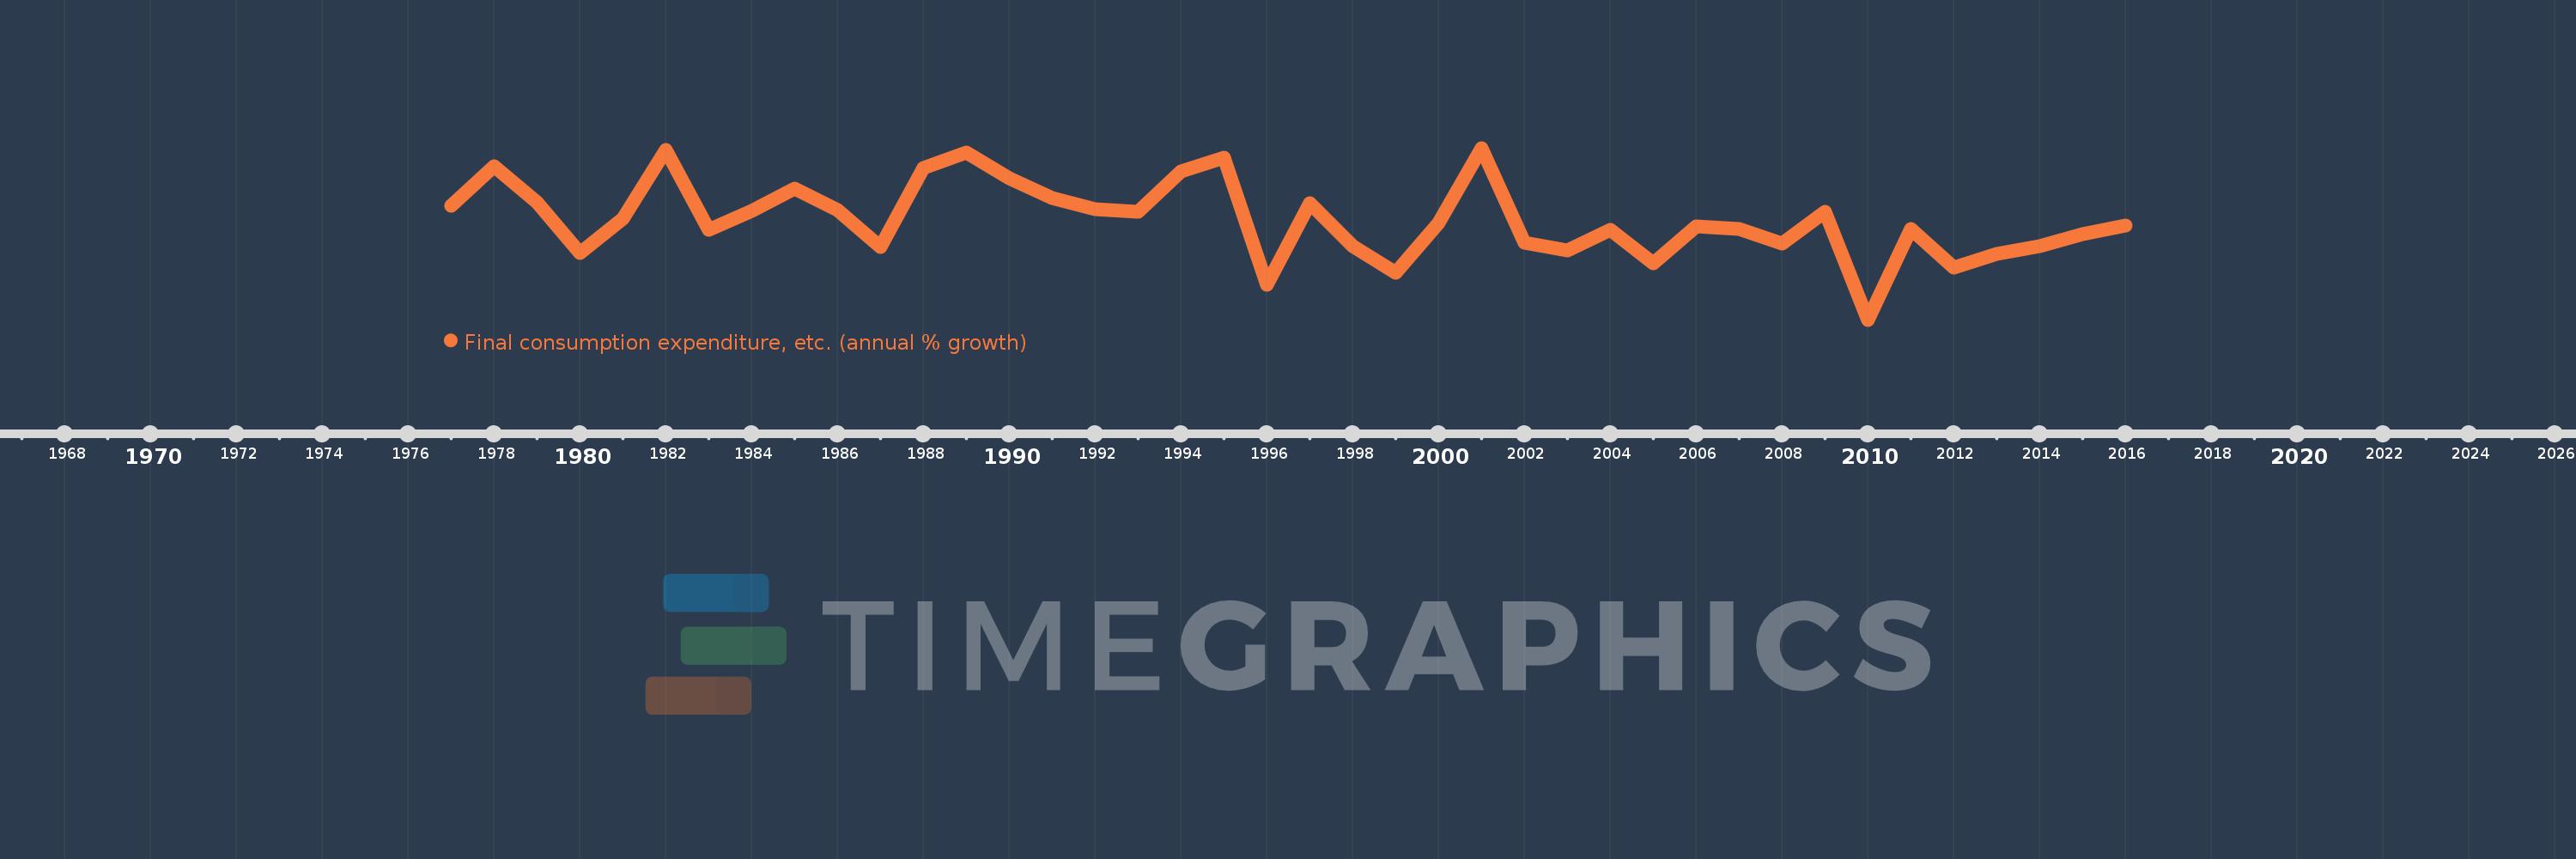
Final consumption expenditure, etc. (annual % growth)
2016,2015,2014,2013,2012,2011,2010,2009,2008,2007,2006,2005,2004,2003,2002,2001,2000,1999,1998,1997,1996,1995,1994,1993,1992,1991,1990,1989,1988,1987,1986,1985,1984,1983,1982,1981,1980,1979,1978,1977
This statistics in other country:
AlbaniaAlgeriaAntigua and BarbudaArab WorldArgentinaArmeniaAustraliaAustriaAzerbaijanBahamas, TheBahrainBangladeshBarbadosBelarusBelgiumBelizeBeninBhutanBoliviaBosnia and HerzegovinaBotswanaBrazilBrunei DarussalamBulgariaBurkina FasoBurundiCabo VerdeCambodiaCameroonCanadaCaribbean small statesCentral Europe and the BalticsChadChileColombiaComorosCongo, Dem. Rep.Congo, Rep.Costa RicaCote d'IvoireCroatiaCubaCyprusCzech RepublicDenmarkDjiboutiDominican RepublicEarly-demographic dividendEast Asia & PacificEcuadorEgypt, Arab Rep.El SalvadorEquatorial GuineaEritreaEstoniaEthiopiaEuro areaEurope & Central AsiaEurope & Central Asia (excluding high income)Europe & Central Asia (IDA & IBRD countries)European UnionFijiFinlandFranceGabonGambia, TheGeorgiaGermanyGhanaGreeceGuatemalaGuineaGuinea-BissauHaitiHeavily indebted poor countries (HIPC)High incomeHondurasHong Kong SAR, ChinaHungaryIBRD onlyIcelandIDA & IBRD totalIDA blendIDA onlyIDA totalIndiaIndonesiaIran, Islamic Rep.IrelandIsraelItalyJamaicaJapanJordanKazakhstanKenyaKorea, Rep.KosovoKuwaitKyrgyz RepublicLao PDRLatin America & Caribbean Latin America & Caribbean (excluding high income)Latin America & the Caribbean (IDA & IBRD countries)LatviaLeast developed countries: UN classificationLebanonLiberiaLithuaniaLow & middle incomeLow incomeLower middle incomeLuxembourgMacao SAR, ChinaMacedonia, FYRMadagascarMalawiMalaysiaMaliMaltaMauritaniaMauritiusMexicoMiddle East & North AfricaMiddle East & North Africa (excluding high income)Middle East & North Africa (IDA & IBRD countries)Middle incomeMoldovaMongoliaMontenegroMoroccoMozambiqueNamibiaNepalNetherlandsNew ZealandNicaraguaNigerNigeriaNorth AmericaNorwayOECD membersOmanOther small statesPakistanPanamaPapua New GuineaParaguayPeruPhilippinesPolandPortugalPost-demographic dividendPre-demographic dividendPuerto RicoQatarRomaniaRussian FederationRwandaSaudi ArabiaSenegalSerbiaSeychellesSierra LeoneSingaporeSlovak RepublicSloveniaSmall statesSomaliaSouth AfricaSouth AsiaSouth Asia (IDA & IBRD)South SudanSpainSri LankaSub-Saharan Africa Sub-Saharan Africa (excluding high income)Sub-Saharan Africa (IDA & IBRD countries)SudanSurinameSwazilandSwedenSwitzerlandSyrian Arab RepublicTajikistanTanzaniaThailandTimor-LesteTogoTrinidad and TobagoTunisiaTurkeyTurkmenistanUgandaUkraineUnited Arab EmiratesUnited KingdomUnited StatesUpper middle incomeUruguayUzbekistanVanuatuVenezuela, RBVietnamWest Bank and GazaWorldZimbabwe Timeline:
This timeline shows a graph from 1977 to 2016 of Singapore. No data until 1976. Number of actual observations by date: 40.
Source name:
World Development Indicators
Source organization:
World Bank national accounts data, and OECD National Accounts data files.
Categories, topics:
Economy & Growth
Last updated:
apr 23, 2017
Indicators value changes by year
Minimum:
-2.621
jan 1, 2010
Maximum:
12.405
jan 1, 2001
At the date of observation
Value
Absolute change
Change from previous value
jan 1, 1977
7.349
+7.349
0.0%
jan 1, 1978
10.836
+3.488
47.46%
jan 1, 1979
7.665
-3.172
-29.27%
jan 1, 1980
3.211
-4.453
-58.1%
jan 1, 1981
6.23
+3.019
94.0%
jan 1, 1982
12.21
+5.98
95.99%
jan 1, 1983
5.272
-6.938
-56.82%
jan 1, 1984
6.917
+1.645
31.2%
jan 1, 1985
8.859
+1.942
28.08%
jan 1, 1986
6.973
-1.886
-21.29%
jan 1, 1987
3.725
-3.248
-46.58%
jan 1, 1988
10.676
+6.951
186.61%
jan 1, 1989
12.044
+1.368
12.82%
jan 1, 1990
9.752
-2.292
-19.03%
jan 1, 1991
8.016
-1.736
-17.8%
jan 1, 1992
7.029
-0.987
-12.31%
jan 1, 1993
6.859
-0.17
-2.43%
jan 1, 1994
10.367
+3.508
51.15%
jan 1, 1995
11.554
+1.188
11.45%
jan 1, 1996
0.428
-11.126
-96.3%
jan 1, 1997
7.565
+7.137
1.67K%
jan 1, 1998
3.85
-3.714
-49.1%
jan 1, 1999
1.524
-2.326
-60.42%
jan 1, 2000
5.81
+4.286
281.24%
jan 1, 2001
12.405
+6.596
113.53%
jan 1, 2002
4.112
-8.294
-66.85%
jan 1, 2003
3.433
-0.679
-16.5%
jan 1, 2004
5.277
+1.844
53.71%
jan 1, 2005
2.284
-2.993
-56.72%
jan 1, 2006
5.542
+3.258
142.67%
jan 1, 2007
5.326
-0.216
-3.9%
jan 1, 2008
4.068
-1.258
-23.62%
jan 1, 2009
6.809
+2.741
67.37%
jan 1, 2010
-2.621
-9.43
-138.5%
jan 1, 2011
5.336
+7.958
-303.59%
jan 1, 2012
1.918
-3.418
-64.05%
jan 1, 2013
3.154
+1.236
64.42%
jan 1, 2014
3.804
+0.65
20.6%
jan 1, 2015
4.869
+1.065
28.0%
jan 1, 2016
5.658
+0.789
16.21%
Ranking of countries by current statistics by years


Comments: