29
/
en
AIzaSyAYiBZKx7MnpbEhh9jyipgxe19OcubqV5w
April 1, 2024
96708
Burundi
BDI
true
2
1
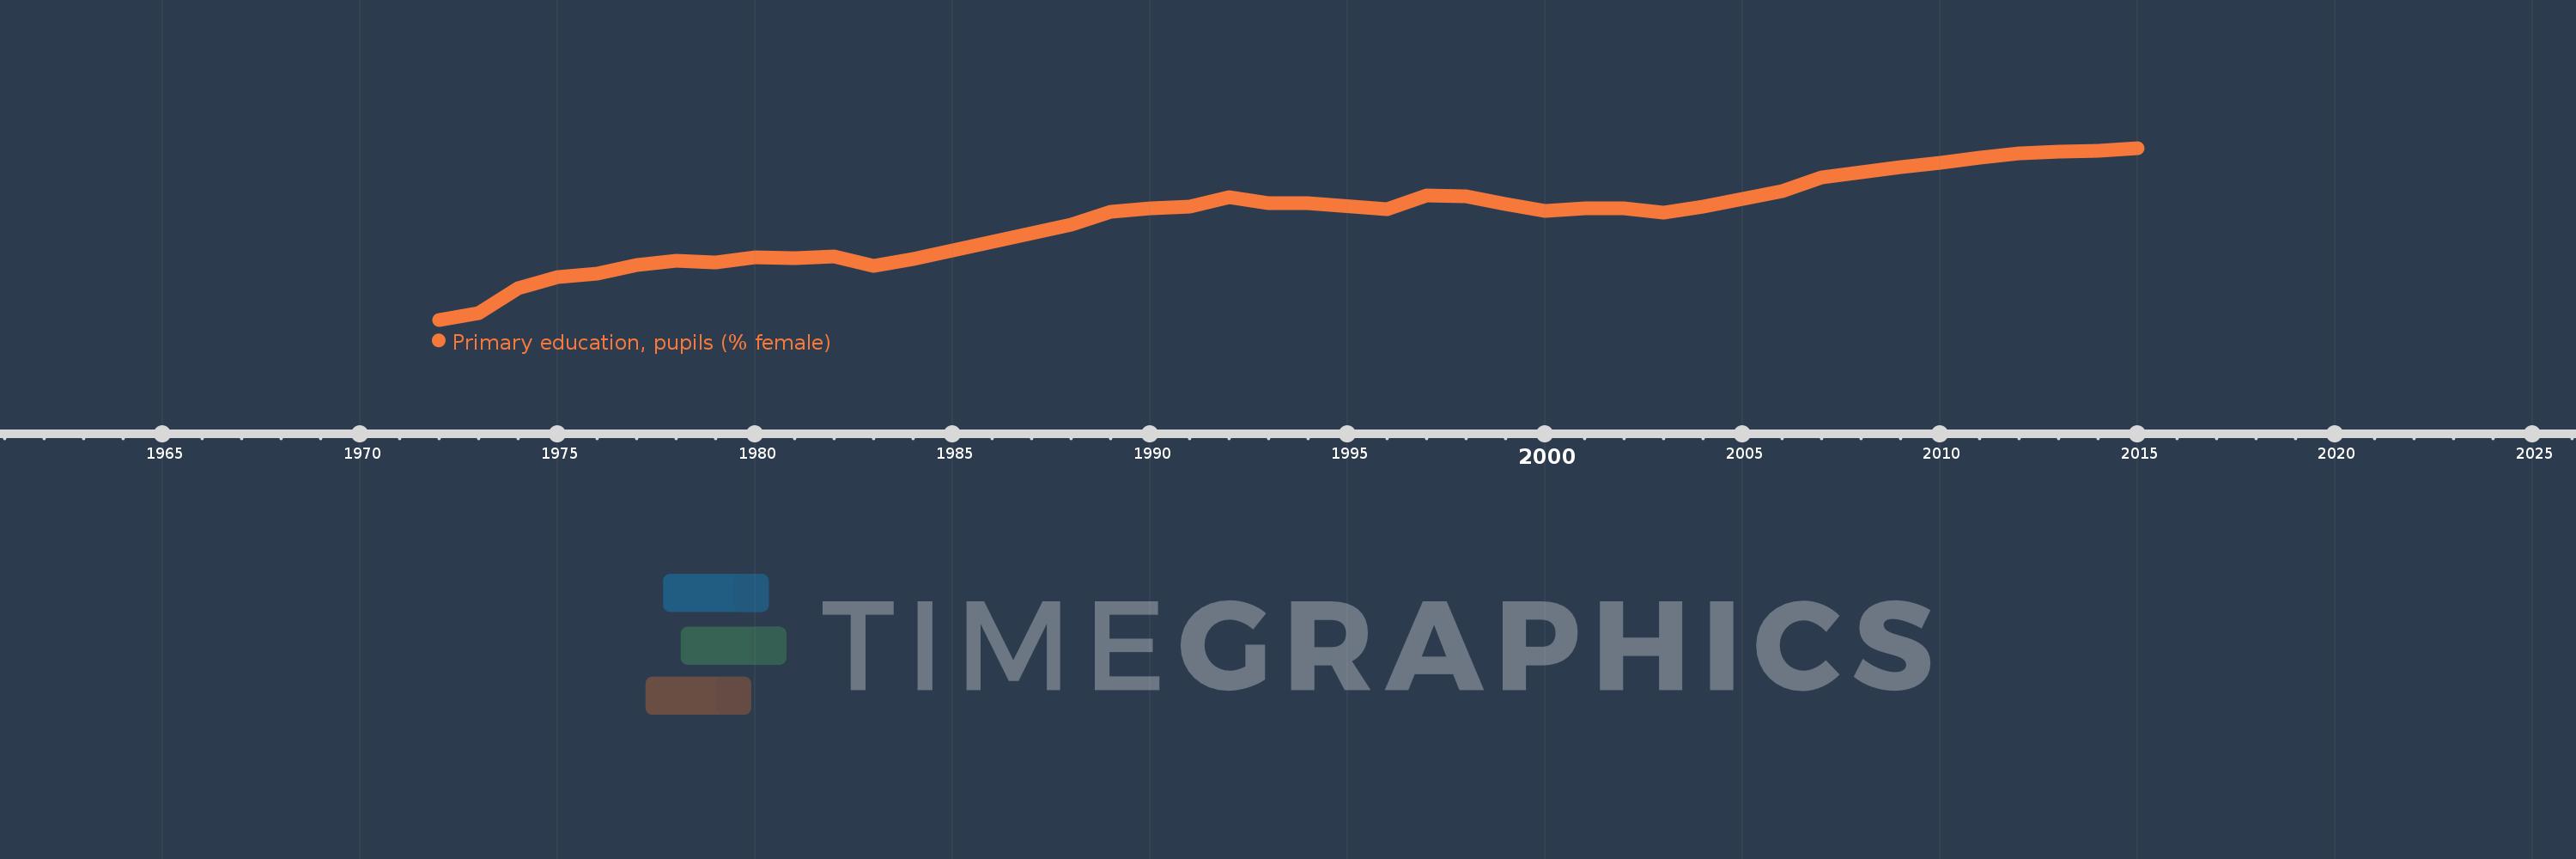
Primary education, pupils (% female)
2015,2014,2013,2012,2011,2010,2009,2008,2007,2006,2005,2004,2003,2002,2001,2000,1999,1998,1997,1996,1994,1993,1992,1991,1990,1989,1988,1987,1986,1985,1984,1983,1982,1981,1980,1979,1978,1977,1976,1975,1974,1973,1972
This statistics in other country:
AfghanistanAlbaniaAlgeriaAndorraAngolaAntigua and BarbudaArab WorldArgentinaArmeniaArubaAustraliaAustriaAzerbaijanBahamas, TheBahrainBangladeshBarbadosBelarusBelgiumBelizeBeninBermudaBhutanBoliviaBosnia and HerzegovinaBotswanaBrazilBritish Virgin IslandsBrunei DarussalamBulgariaBurkina FasoBurundiCabo VerdeCambodiaCameroonCanadaCaribbean small statesCayman IslandsCentral African RepublicCentral Europe and the BalticsChadChileChinaColombiaComorosCongo, Dem. Rep.Congo, Rep.Costa RicaCote d'IvoireCroatiaCubaCuracaoCyprusCzech RepublicDenmarkDjiboutiDominicaDominican RepublicEarly-demographic dividendEast Asia & PacificEast Asia & Pacific (excluding high income)East Asia & Pacific (IDA & IBRD countries)EcuadorEgypt, Arab Rep.El SalvadorEquatorial GuineaEritreaEstoniaEthiopiaEuro areaEurope & Central AsiaEurope & Central Asia (excluding high income)Europe & Central Asia (IDA & IBRD countries)European UnionFijiFinlandFragile and conflict affected situationsFranceGabonGambia, TheGeorgiaGermanyGhanaGibraltarGreeceGrenadaGuatemalaGuineaGuinea-BissauGuyanaHaitiHeavily indebted poor countries (HIPC)High incomeHondurasHong Kong SAR, ChinaHungaryIBRD onlyIcelandIDA & IBRD totalIDA blendIDA onlyIDA totalIndiaIndonesiaIran, Islamic Rep.IraqIrelandIsraelItalyJamaicaJapanJordanKazakhstanKenyaKiribatiKorea, Dem. People’s Rep.Korea, Rep.KuwaitKyrgyz RepublicLao PDRLate-demographic dividendLatin America & Caribbean Latin America & Caribbean (excluding high income)Latin America & the Caribbean (IDA & IBRD countries)LatviaLeast developed countries: UN classificationLebanonLesothoLiberiaLibyaLiechtensteinLithuaniaLow & middle incomeLow incomeLower middle incomeLuxembourgMacao SAR, ChinaMacedonia, FYRMadagascarMalawiMalaysiaMaldivesMaliMaltaMarshall IslandsMauritaniaMauritiusMexicoMicronesia, Fed. Sts.Middle East & North AfricaMiddle East & North Africa (excluding high income)Middle East & North Africa (IDA & IBRD countries)Middle incomeMoldovaMonacoMongoliaMontenegroMoroccoMozambiqueMyanmarNamibiaNauruNepalNetherlandsNew ZealandNicaraguaNigerNigeriaNorth AmericaNorwayOECD membersOmanOther small statesPacific island small statesPakistanPalauPanamaPapua New GuineaParaguayPeruPhilippinesPolandPortugalPost-demographic dividendPre-demographic dividendPuerto RicoQatarRomaniaRussian FederationRwandaSamoaSan MarinoSao Tome and PrincipeSaudi ArabiaSenegalSerbiaSeychellesSierra LeoneSingaporeSint Maarten (Dutch part)Slovak RepublicSloveniaSmall statesSolomon IslandsSomaliaSouth AfricaSouth AsiaSouth Asia (IDA & IBRD)South SudanSpainSri LankaSt. Kitts and NevisSt. LuciaSt. Vincent and the GrenadinesSub-Saharan Africa Sub-Saharan Africa (excluding high income)Sub-Saharan Africa (IDA & IBRD countries)SudanSurinameSwazilandSwedenSwitzerlandSyrian Arab RepublicTajikistanTanzaniaThailandTimor-LesteTogoTongaTrinidad and TobagoTunisiaTurkeyTurkmenistanTurks and Caicos IslandsTuvaluUgandaUkraineUnited Arab EmiratesUnited KingdomUnited StatesUpper middle incomeUruguayUzbekistanVanuatuVenezuela, RBVietnamWest Bank and GazaWorldYemen, Rep.ZambiaZimbabwe Timeline:
This timeline shows a graph from 1972 to 2015 of Burundi. No data until 1971. Number of actual observations by date: 43.
Source name:
World Development Indicators
Source organization:
United Nations Educational, Scientific, and Cultural Organization (UNESCO) Institute for Statistics.
Categories, topics:
Education, Gender
Last updated:
apr 23, 2017
Indicators value changes by year
Minimum:
32.925
jan 1, 1972
Maximum:
50.676
jan 1, 2015
At the date of observation
Value
Absolute change
Change from previous value
jan 1, 1972
32.925
+32.925
0.0%
jan 1, 1973
33.588
+0.663
2.01%
jan 1, 1974
36.189
+2.601
7.75%
jan 1, 1975
37.328
+1.139
3.15%
jan 1, 1976
37.731
+0.403
1.08%
jan 1, 1977
38.616
+0.884
2.34%
jan 1, 1978
39.048
+0.432
1.12%
jan 1, 1979
38.871
-0.177
-0.45%
jan 1, 1980
39.373
+0.502
1.29%
jan 1, 1981
39.329
-0.044
-0.11%
jan 1, 1982
39.437
+0.108
0.27%
jan 1, 1983
38.467
-0.969
-2.46%
jan 1, 1984
39.207
+0.74
1.92%
jan 1, 1985
40.045
+0.838
2.14%
jan 1, 1986
40.965
+0.92
2.3%
jan 1, 1987
41.839
+0.874
2.13%
jan 1, 1988
42.758
+0.918
2.19%
jan 1, 1989
44.061
+1.303
3.05%
jan 1, 1990
44.457
+0.397
0.9%
jan 1, 1991
44.59
+0.133
0.3%
jan 1, 1992
45.625
+1.035
2.32%
jan 1, 1993
44.968
-0.656
-1.44%
jan 1, 1994
44.987
+0.019
0.04%
jan 1, 1996
44.386
-0.602
-1.34%
jan 1, 1997
45.786
+1.4
3.16%
jan 1, 1998
45.648
-0.138
-0.3%
jan 1, 1999
44.877
-0.772
-1.69%
jan 1, 2000
44.129
-0.748
-1.67%
jan 1, 2001
44.424
+0.295
0.67%
jan 1, 2002
44.396
-0.028
-0.06%
jan 1, 2003
43.95
-0.447
-1.01%
jan 1, 2004
44.6
+0.651
1.48%
jan 1, 2005
45.429
+0.829
1.86%
jan 1, 2006
46.185
+0.756
1.66%
jan 1, 2007
47.651
+1.466
3.17%
jan 1, 2008
48.179
+0.528
1.11%
jan 1, 2009
48.727
+0.548
1.14%
jan 1, 2010
49.161
+0.434
0.89%
jan 1, 2011
49.67
+0.509
1.04%
jan 1, 2012
50.104
+0.434
0.87%
jan 1, 2013
50.302
+0.198
0.4%
jan 1, 2014
50.369
+0.066
0.13%
jan 1, 2015
50.676
+0.307
0.61%
Ranking of countries by current statistics by years


Comments: