29
/
en
AIzaSyAYiBZKx7MnpbEhh9jyipgxe19OcubqV5w
April 1, 2024
280320
Vanuatu
VUT
true
2
1
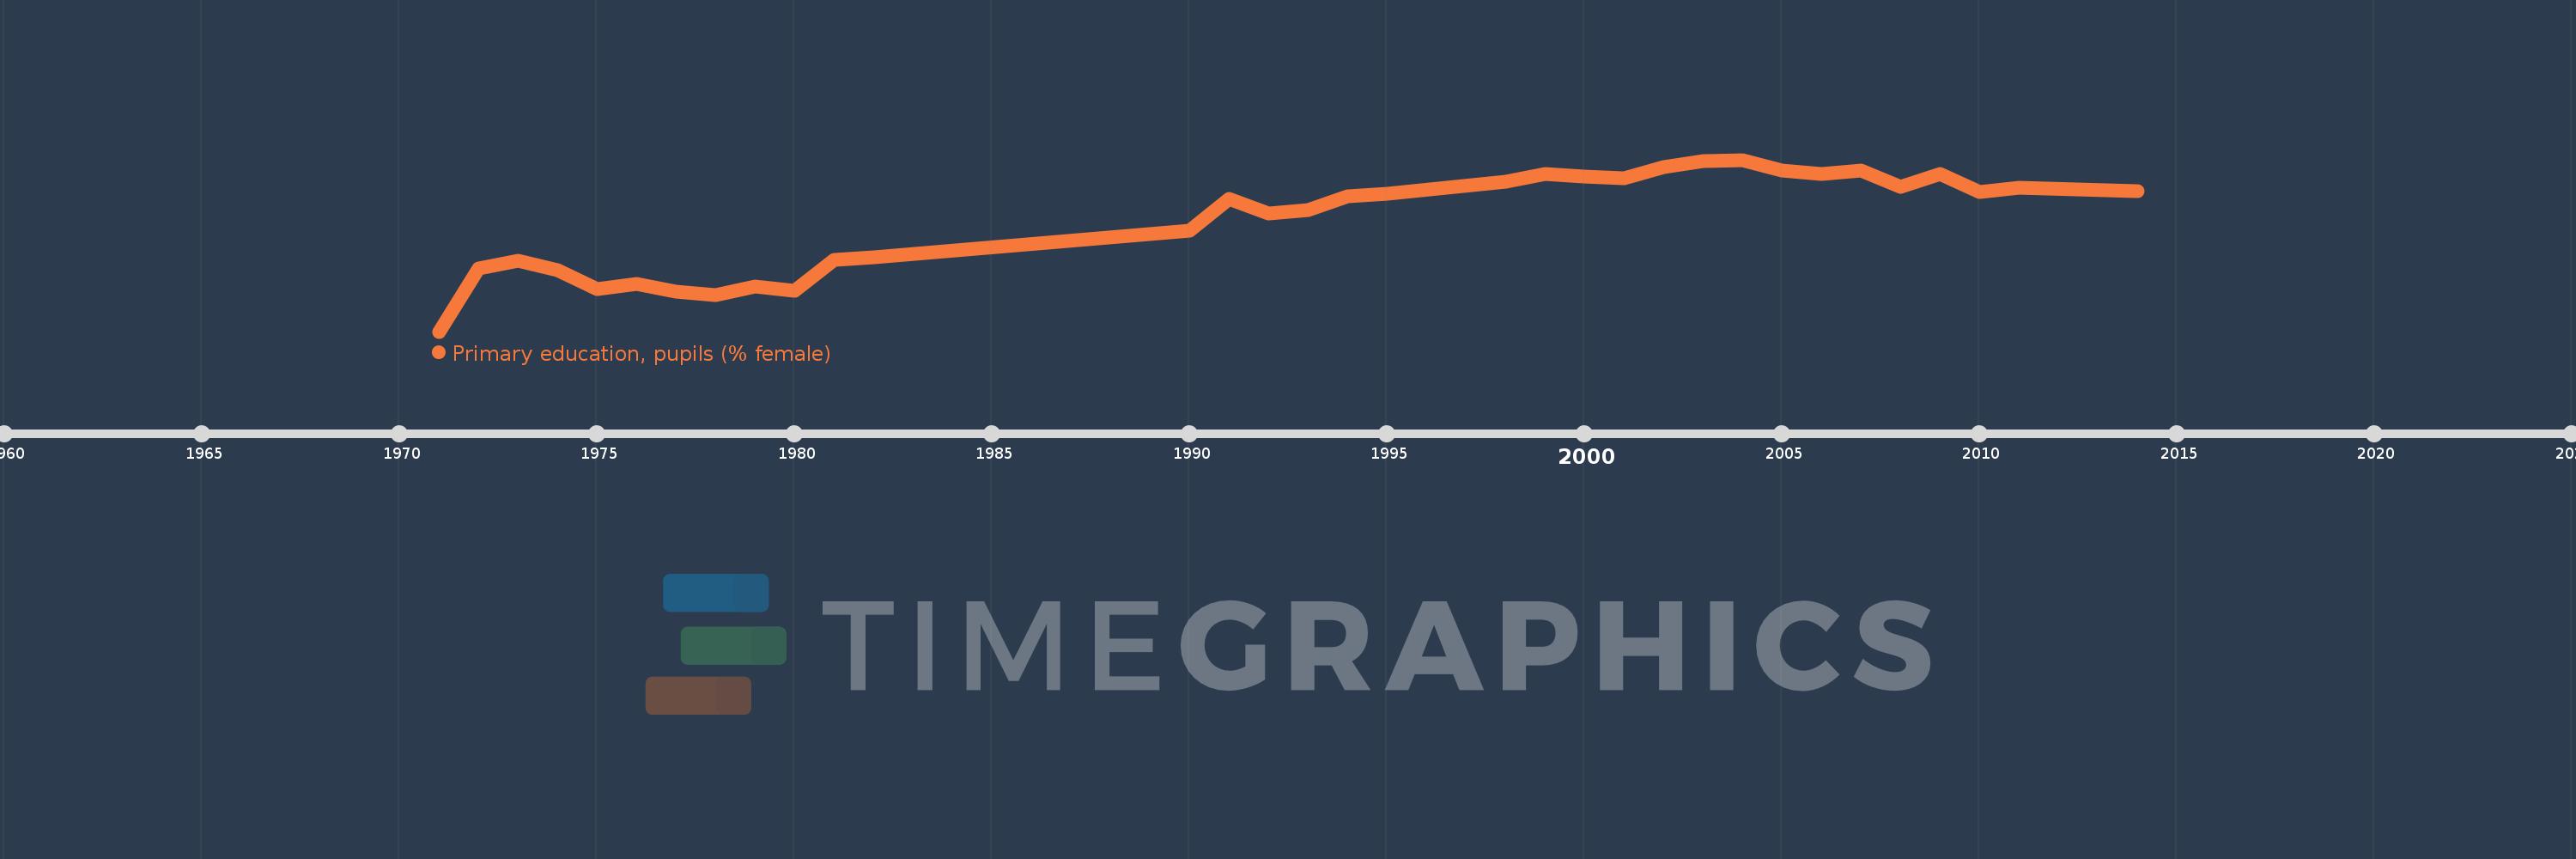
Primary education, pupils (% female)
2014,2011,2010,2009,2008,2007,2006,2005,2004,2003,2002,2001,2000,1999,1998,1995,1994,1993,1992,1991,1990,1982,1981,1980,1979,1978,1977,1976,1975,1974,1973,1972,1971
This statistics in other country:
AfghanistanAlbaniaAlgeriaAndorraAngolaAntigua and BarbudaArab WorldArgentinaArmeniaArubaAustraliaAustriaAzerbaijanBahamas, TheBahrainBangladeshBarbadosBelarusBelgiumBelizeBeninBermudaBhutanBoliviaBosnia and HerzegovinaBotswanaBrazilBritish Virgin IslandsBrunei DarussalamBulgariaBurkina FasoBurundiCabo VerdeCambodiaCameroonCanadaCaribbean small statesCayman IslandsCentral African RepublicCentral Europe and the BalticsChadChileChinaColombiaComorosCongo, Dem. Rep.Congo, Rep.Costa RicaCote d'IvoireCroatiaCubaCuracaoCyprusCzech RepublicDenmarkDjiboutiDominicaDominican RepublicEarly-demographic dividendEast Asia & PacificEast Asia & Pacific (excluding high income)East Asia & Pacific (IDA & IBRD countries)EcuadorEgypt, Arab Rep.El SalvadorEquatorial GuineaEritreaEstoniaEthiopiaEuro areaEurope & Central AsiaEurope & Central Asia (excluding high income)Europe & Central Asia (IDA & IBRD countries)European UnionFijiFinlandFragile and conflict affected situationsFranceGabonGambia, TheGeorgiaGermanyGhanaGibraltarGreeceGrenadaGuatemalaGuineaGuinea-BissauGuyanaHaitiHeavily indebted poor countries (HIPC)High incomeHondurasHong Kong SAR, ChinaHungaryIBRD onlyIcelandIDA & IBRD totalIDA blendIDA onlyIDA totalIndiaIndonesiaIran, Islamic Rep.IraqIrelandIsraelItalyJamaicaJapanJordanKazakhstanKenyaKiribatiKorea, Dem. People’s Rep.Korea, Rep.KuwaitKyrgyz RepublicLao PDRLate-demographic dividendLatin America & Caribbean Latin America & Caribbean (excluding high income)Latin America & the Caribbean (IDA & IBRD countries)LatviaLeast developed countries: UN classificationLebanonLesothoLiberiaLibyaLiechtensteinLithuaniaLow & middle incomeLow incomeLower middle incomeLuxembourgMacao SAR, ChinaMacedonia, FYRMadagascarMalawiMalaysiaMaldivesMaliMaltaMarshall IslandsMauritaniaMauritiusMexicoMicronesia, Fed. Sts.Middle East & North AfricaMiddle East & North Africa (excluding high income)Middle East & North Africa (IDA & IBRD countries)Middle incomeMoldovaMonacoMongoliaMontenegroMoroccoMozambiqueMyanmarNamibiaNauruNepalNetherlandsNew ZealandNicaraguaNigerNigeriaNorth AmericaNorwayOECD membersOmanOther small statesPacific island small statesPakistanPalauPanamaPapua New GuineaParaguayPeruPhilippinesPolandPortugalPost-demographic dividendPre-demographic dividendPuerto RicoQatarRomaniaRussian FederationRwandaSamoaSan MarinoSao Tome and PrincipeSaudi ArabiaSenegalSerbiaSeychellesSierra LeoneSingaporeSint Maarten (Dutch part)Slovak RepublicSloveniaSmall statesSolomon IslandsSomaliaSouth AfricaSouth AsiaSouth Asia (IDA & IBRD)South SudanSpainSri LankaSt. Kitts and NevisSt. LuciaSt. Vincent and the GrenadinesSub-Saharan Africa Sub-Saharan Africa (excluding high income)Sub-Saharan Africa (IDA & IBRD countries)SudanSurinameSwazilandSwedenSwitzerlandSyrian Arab RepublicTajikistanTanzaniaThailandTimor-LesteTogoTongaTrinidad and TobagoTunisiaTurkeyTurkmenistanTurks and Caicos IslandsTuvaluUgandaUkraineUnited Arab EmiratesUnited KingdomUnited StatesUpper middle incomeUruguayUzbekistanVanuatuVenezuela, RBVietnamWest Bank and GazaWorldYemen, Rep.ZambiaZimbabwe Timeline:
This timeline shows a graph from 1971 to 2014 of Vanuatu. No data until 1970. Number of actual observations by date: 33.
Source name:
World Development Indicators
Source organization:
United Nations Educational, Scientific, and Cultural Organization (UNESCO) Institute for Statistics.
Categories, topics:
Education, Gender
Last updated:
apr 23, 2017
Indicators value changes by year
Minimum:
43.742
jan 1, 1971
At the date of observation
Value
Absolute change
Change from previous value
jan 1, 1971
43.742
+43.742
0.0%
jan 1, 1972
45.317
+1.575
3.6%
jan 1, 1973
45.511
+0.193
0.43%
jan 1, 1974
45.284
-0.227
-0.5%
jan 1, 1975
44.812
-0.472
-1.04%
jan 1, 1976
44.932
+0.12
0.27%
jan 1, 1977
44.745
-0.186
-0.41%
jan 1, 1978
44.648
-0.097
-0.22%
jan 1, 1979
44.871
+0.223
0.5%
jan 1, 1980
44.758
-0.113
-0.25%
jan 1, 1981
45.534
+0.776
1.73%
jan 1, 1982
45.601
+0.067
0.15%
jan 1, 1990
46.276
+0.675
1.48%
jan 1, 1991
47.068
+0.792
1.71%
jan 1, 1992
46.694
-0.374
-0.8%
jan 1, 1993
46.781
+0.087
0.19%
jan 1, 1994
47.125
+0.344
0.74%
jan 1, 1995
47.201
+0.075
0.16%
jan 1, 1998
47.504
+0.303
0.64%
jan 1, 1999
47.687
+0.183
0.39%
jan 1, 2000
47.628
-0.059
-0.12%
jan 1, 2001
47.584
-0.044
-0.09%
jan 1, 2002
47.865
+0.281
0.59%
jan 1, 2003
48.02
+0.155
0.32%
jan 1, 2004
48.05
+0.03
0.06%
jan 1, 2005
47.77
-0.281
-0.58%
jan 1, 2006
47.693
-0.077
-0.16%
jan 1, 2007
47.79
+0.097
0.2%
jan 1, 2008
47.362
-0.428
-0.9%
jan 1, 2009
47.685
+0.323
0.68%
jan 1, 2010
47.237
-0.448
-0.94%
jan 1, 2011
47.344
+0.107
0.23%
jan 1, 2014
47.269
-0.075
-0.16%
Ranking of countries by current statistics by years


Comments: