29
/
en
AIzaSyAYiBZKx7MnpbEhh9jyipgxe19OcubqV5w
April 1, 2024
59299
Sub-Saharan Africa
SSF
false
2
1
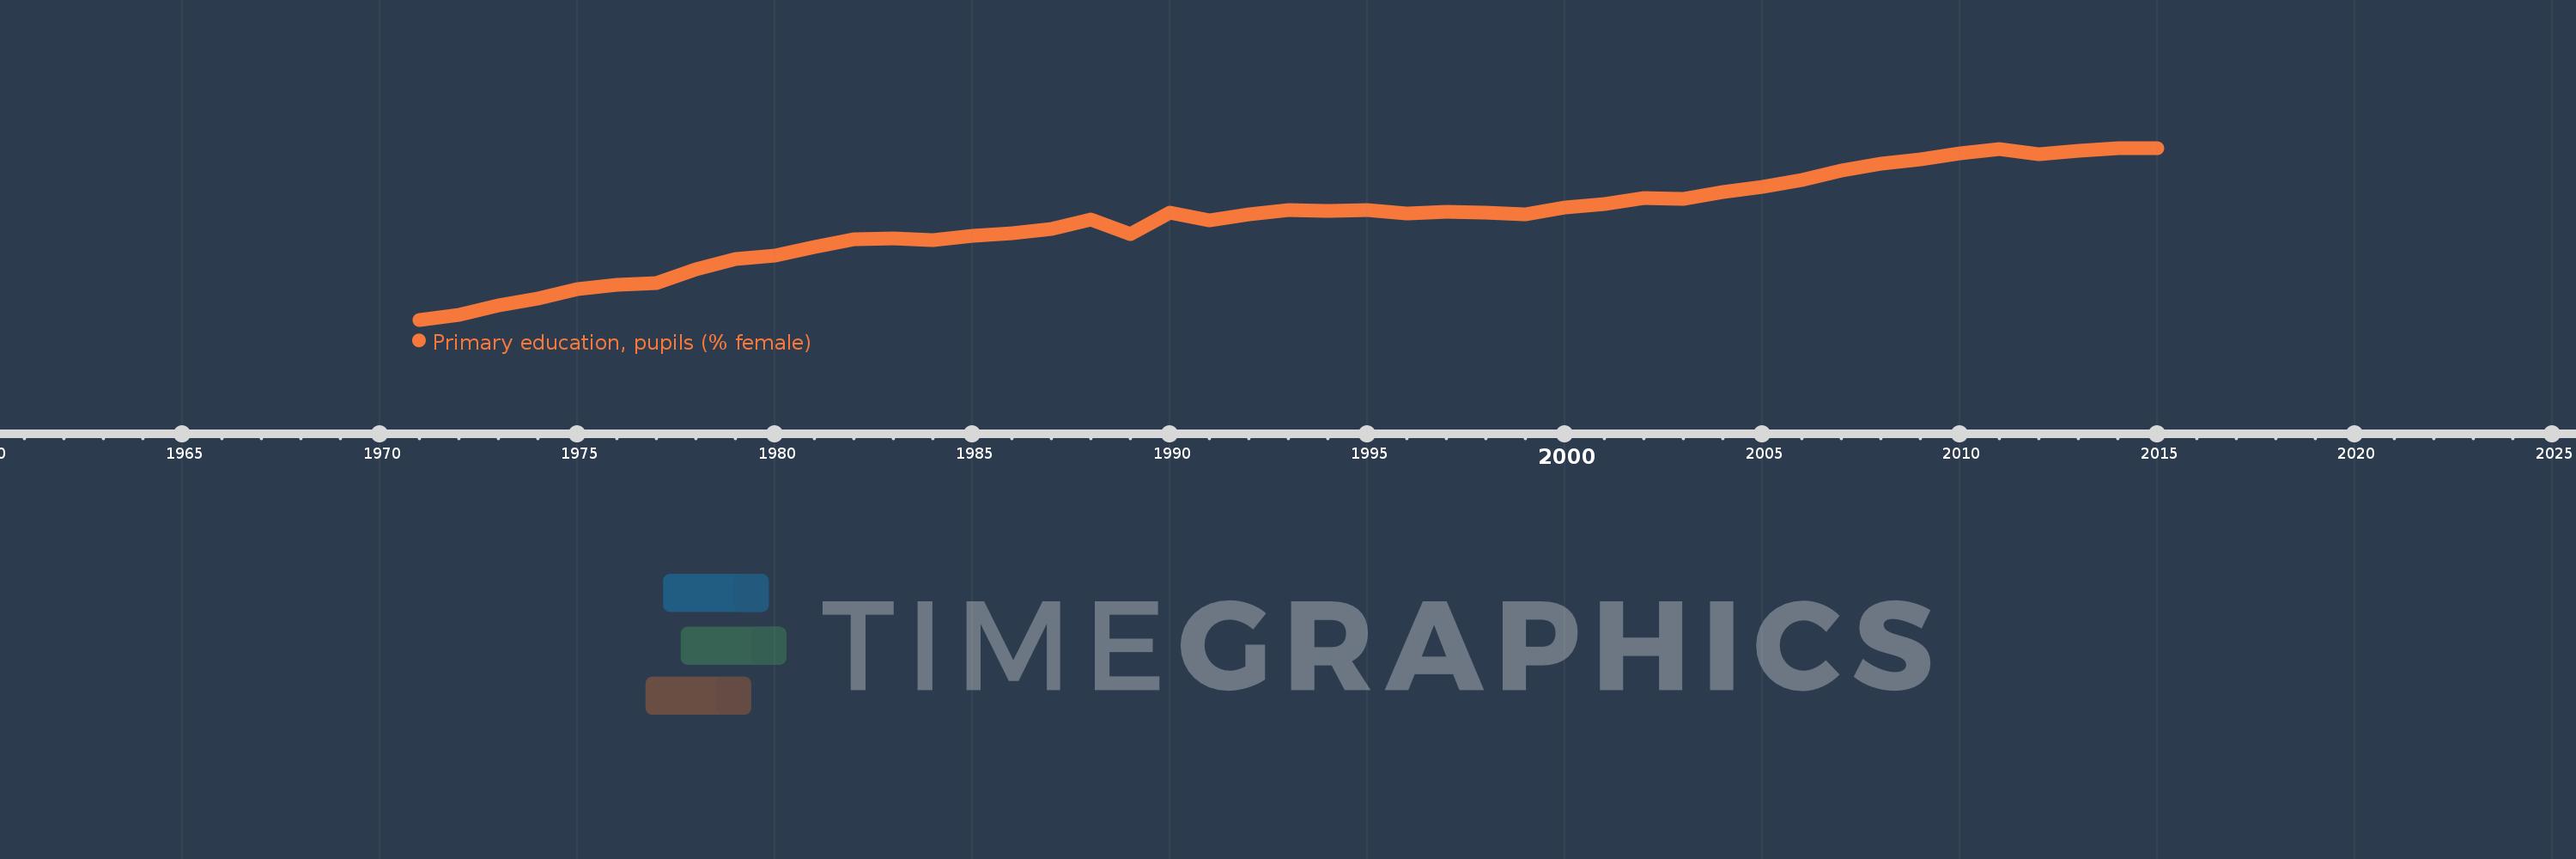
Primary education, pupils (% female)
2015,2014,2013,2012,2011,2010,2009,2008,2007,2006,2005,2004,2003,2002,2001,2000,1999,1998,1997,1996,1995,1994,1993,1992,1991,1990,1989,1988,1987,1986,1985,1984,1983,1982,1981,1980,1979,1978,1977,1976,1975,1974,1973,1972,1971
This statistics in other country:
AfghanistanAlbaniaAlgeriaAndorraAngolaAntigua and BarbudaArab WorldArgentinaArmeniaArubaAustraliaAustriaAzerbaijanBahamas, TheBahrainBangladeshBarbadosBelarusBelgiumBelizeBeninBermudaBhutanBoliviaBosnia and HerzegovinaBotswanaBrazilBritish Virgin IslandsBrunei DarussalamBulgariaBurkina FasoBurundiCabo VerdeCambodiaCameroonCanadaCaribbean small statesCayman IslandsCentral African RepublicCentral Europe and the BalticsChadChileChinaColombiaComorosCongo, Dem. Rep.Congo, Rep.Costa RicaCote d'IvoireCroatiaCubaCuracaoCyprusCzech RepublicDenmarkDjiboutiDominicaDominican RepublicEarly-demographic dividendEast Asia & PacificEast Asia & Pacific (excluding high income)East Asia & Pacific (IDA & IBRD countries)EcuadorEgypt, Arab Rep.El SalvadorEquatorial GuineaEritreaEstoniaEthiopiaEuro areaEurope & Central AsiaEurope & Central Asia (excluding high income)Europe & Central Asia (IDA & IBRD countries)European UnionFijiFinlandFragile and conflict affected situationsFranceGabonGambia, TheGeorgiaGermanyGhanaGibraltarGreeceGrenadaGuatemalaGuineaGuinea-BissauGuyanaHaitiHeavily indebted poor countries (HIPC)High incomeHondurasHong Kong SAR, ChinaHungaryIBRD onlyIcelandIDA & IBRD totalIDA blendIDA onlyIDA totalIndiaIndonesiaIran, Islamic Rep.IraqIrelandIsraelItalyJamaicaJapanJordanKazakhstanKenyaKiribatiKorea, Dem. People’s Rep.Korea, Rep.KuwaitKyrgyz RepublicLao PDRLate-demographic dividendLatin America & Caribbean Latin America & Caribbean (excluding high income)Latin America & the Caribbean (IDA & IBRD countries)LatviaLeast developed countries: UN classificationLebanonLesothoLiberiaLibyaLiechtensteinLithuaniaLow & middle incomeLow incomeLower middle incomeLuxembourgMacao SAR, ChinaMacedonia, FYRMadagascarMalawiMalaysiaMaldivesMaliMaltaMarshall IslandsMauritaniaMauritiusMexicoMicronesia, Fed. Sts.Middle East & North AfricaMiddle East & North Africa (excluding high income)Middle East & North Africa (IDA & IBRD countries)Middle incomeMoldovaMonacoMongoliaMontenegroMoroccoMozambiqueMyanmarNamibiaNauruNepalNetherlandsNew ZealandNicaraguaNigerNigeriaNorth AmericaNorwayOECD membersOmanOther small statesPacific island small statesPakistanPalauPanamaPapua New GuineaParaguayPeruPhilippinesPolandPortugalPost-demographic dividendPre-demographic dividendPuerto RicoQatarRomaniaRussian FederationRwandaSamoaSan MarinoSao Tome and PrincipeSaudi ArabiaSenegalSerbiaSeychellesSierra LeoneSingaporeSint Maarten (Dutch part)Slovak RepublicSloveniaSmall statesSolomon IslandsSomaliaSouth AfricaSouth AsiaSouth Asia (IDA & IBRD)South SudanSpainSri LankaSt. Kitts and NevisSt. LuciaSt. Vincent and the GrenadinesSub-Saharan Africa Sub-Saharan Africa (excluding high income)Sub-Saharan Africa (IDA & IBRD countries)SudanSurinameSwazilandSwedenSwitzerlandSyrian Arab RepublicTajikistanTanzaniaThailandTimor-LesteTogoTongaTrinidad and TobagoTunisiaTurkeyTurkmenistanTurks and Caicos IslandsTuvaluUgandaUkraineUnited Arab EmiratesUnited KingdomUnited StatesUpper middle incomeUruguayUzbekistanVanuatuVenezuela, RBVietnamWest Bank and GazaWorldYemen, Rep.ZambiaZimbabwe Timeline:
This timeline shows a graph from 1971 to 2015 of Sub-Saharan Africa . No data until 1970. Number of actual observations by date: 45.
Source name:
World Development Indicators
Source organization:
United Nations Educational, Scientific, and Cultural Organization (UNESCO) Institute for Statistics.
Categories, topics:
Education, Gender
Last updated:
apr 23, 2017
Indicators value changes by year
Minimum:
41.383
jan 1, 1971
Maximum:
47.657
jan 1, 2015
At the date of observation
Value
Absolute change
Change from previous value
jan 1, 1971
41.383
+41.383
0.0%
jan 1, 1972
41.568
+0.185
0.45%
jan 1, 1973
41.892
+0.324
0.78%
jan 1, 1974
42.157
+0.264
0.63%
jan 1, 1975
42.513
+0.356
0.84%
jan 1, 1976
42.661
+0.148
0.35%
jan 1, 1977
42.718
+0.057
0.13%
jan 1, 1978
43.211
+0.493
1.15%
jan 1, 1979
43.588
+0.377
0.87%
jan 1, 1980
43.714
+0.126
0.29%
jan 1, 1981
44.051
+0.337
0.77%
jan 1, 1982
44.331
+0.28
0.63%
jan 1, 1983
44.346
+0.015
0.03%
jan 1, 1984
44.297
-0.049
-0.11%
jan 1, 1985
44.443
+0.146
0.33%
jan 1, 1986
44.537
+0.094
0.21%
jan 1, 1987
44.707
+0.17
0.38%
jan 1, 1988
45.051
+0.344
0.77%
jan 1, 1989
44.497
-0.554
-1.23%
jan 1, 1990
45.295
+0.798
1.79%
jan 1, 1991
45.0
-0.295
-0.65%
jan 1, 1992
45.22
+0.22
0.49%
jan 1, 1993
45.374
+0.154
0.34%
jan 1, 1994
45.355
-0.019
-0.04%
jan 1, 1995
45.403
+0.048
0.11%
jan 1, 1996
45.248
-0.155
-0.34%
jan 1, 1997
45.341
+0.093
0.21%
jan 1, 1998
45.302
-0.039
-0.08%
jan 1, 1999
45.243
-0.059
-0.13%
jan 1, 2000
45.488
+0.245
0.54%
jan 1, 2001
45.605
+0.116
0.26%
jan 1, 2002
45.816
+0.212
0.46%
jan 1, 2003
45.801
-0.016
-0.03%
jan 1, 2004
46.036
+0.235
0.51%
jan 1, 2005
46.235
+0.199
0.43%
jan 1, 2006
46.486
+0.251
0.54%
jan 1, 2007
46.817
+0.331
0.71%
jan 1, 2008
47.071
+0.254
0.54%
jan 1, 2009
47.255
+0.184
0.39%
jan 1, 2010
47.465
+0.21
0.45%
jan 1, 2011
47.612
+0.147
0.31%
jan 1, 2012
47.429
-0.183
-0.38%
jan 1, 2013
47.539
+0.11
0.23%
jan 1, 2014
47.633
+0.094
0.2%
jan 1, 2015
47.657
+0.024
0.05%
Ranking of countries by current statistics by years


Comments: