29
/
en
AIzaSyAYiBZKx7MnpbEhh9jyipgxe19OcubqV5w
April 1, 2024
185806
Madagascar
MDG
true
2
1
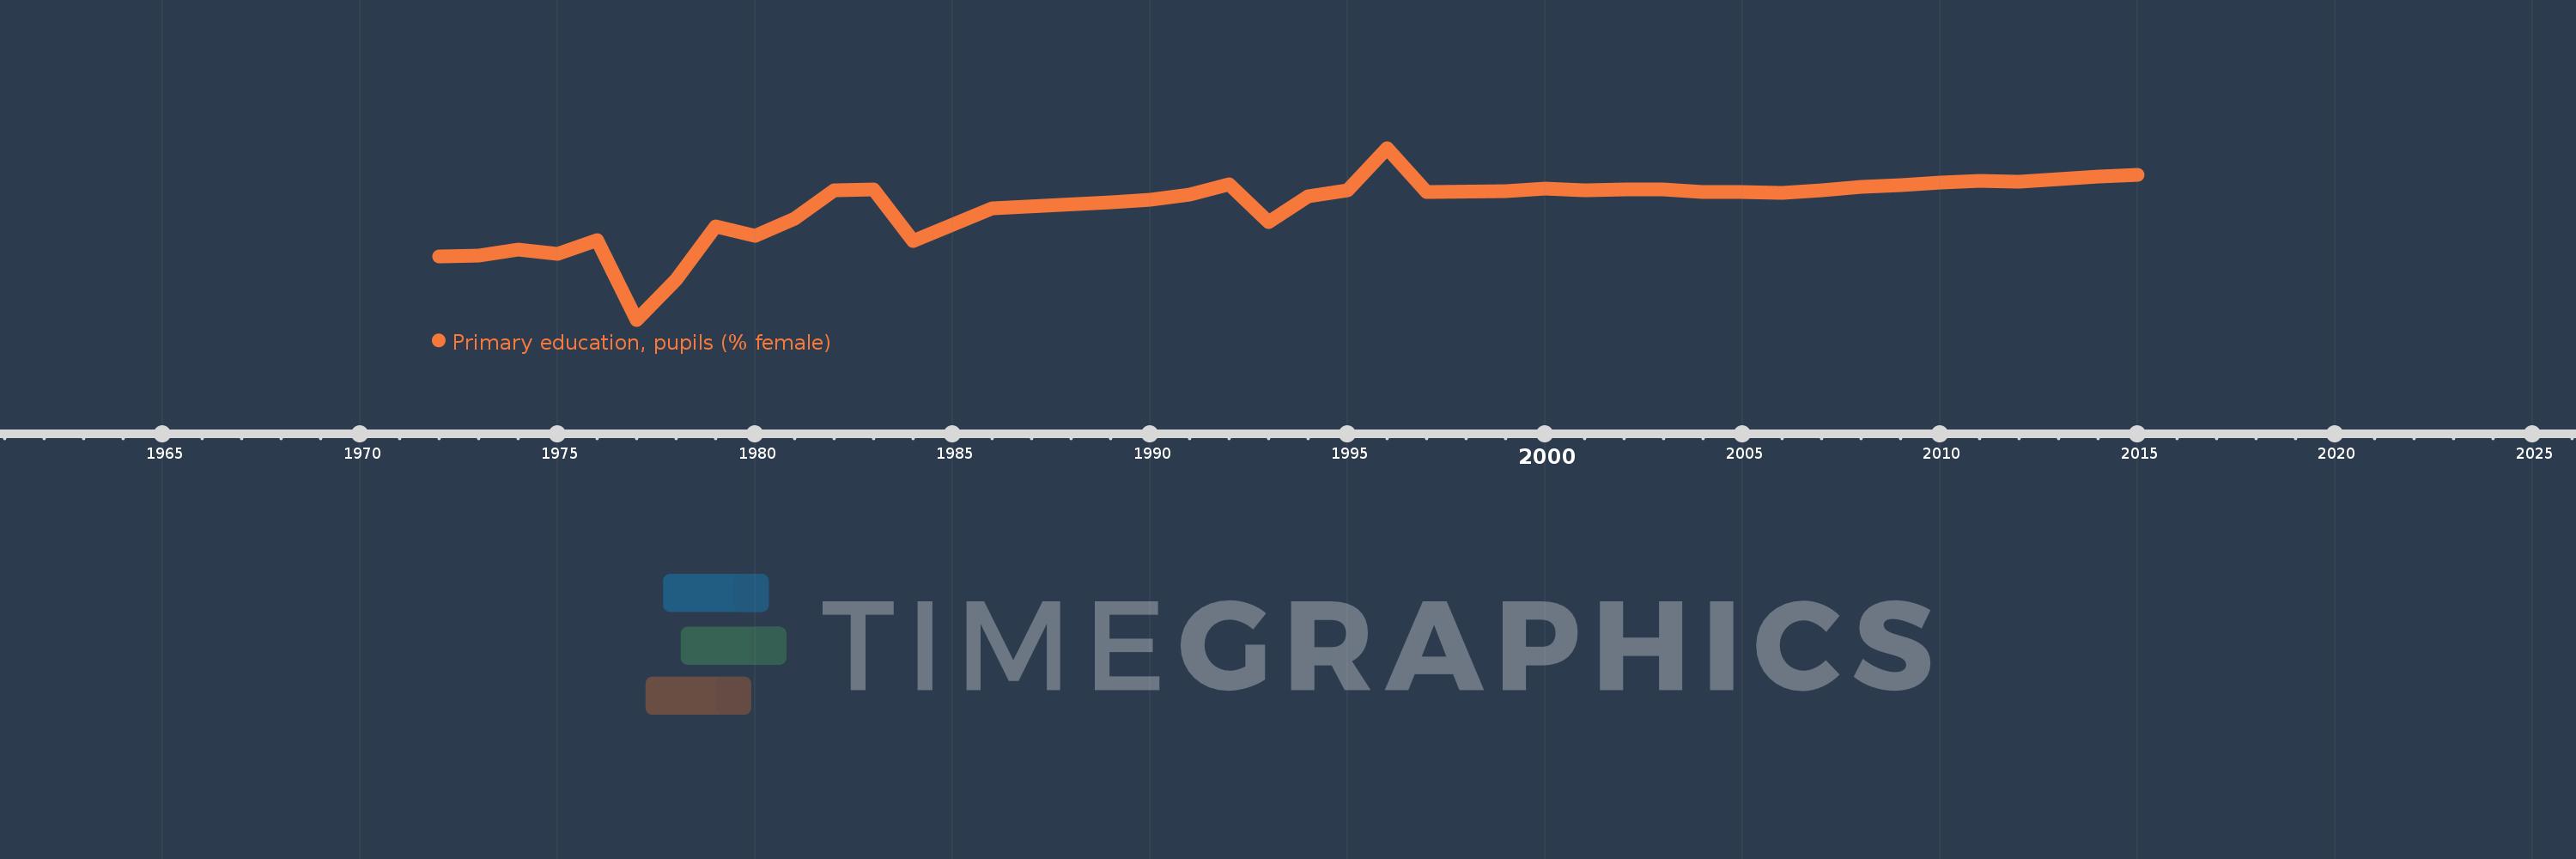
Primary education, pupils (% female)
2015,2014,2013,2012,2011,2010,2009,2008,2007,2006,2005,2004,2003,2002,2001,2000,1999,1997,1996,1995,1994,1993,1992,1991,1990,1989,1986,1984,1983,1982,1981,1980,1979,1978,1977,1976,1975,1974,1973,1972
This statistics in other country:
AfghanistanAlbaniaAlgeriaAndorraAngolaAntigua and BarbudaArab WorldArgentinaArmeniaArubaAustraliaAustriaAzerbaijanBahamas, TheBahrainBangladeshBarbadosBelarusBelgiumBelizeBeninBermudaBhutanBoliviaBosnia and HerzegovinaBotswanaBrazilBritish Virgin IslandsBrunei DarussalamBulgariaBurkina FasoBurundiCabo VerdeCambodiaCameroonCanadaCaribbean small statesCayman IslandsCentral African RepublicCentral Europe and the BalticsChadChileChinaColombiaComorosCongo, Dem. Rep.Congo, Rep.Costa RicaCote d'IvoireCroatiaCubaCuracaoCyprusCzech RepublicDenmarkDjiboutiDominicaDominican RepublicEarly-demographic dividendEast Asia & PacificEast Asia & Pacific (excluding high income)East Asia & Pacific (IDA & IBRD countries)EcuadorEgypt, Arab Rep.El SalvadorEquatorial GuineaEritreaEstoniaEthiopiaEuro areaEurope & Central AsiaEurope & Central Asia (excluding high income)Europe & Central Asia (IDA & IBRD countries)European UnionFijiFinlandFragile and conflict affected situationsFranceGabonGambia, TheGeorgiaGermanyGhanaGibraltarGreeceGrenadaGuatemalaGuineaGuinea-BissauGuyanaHaitiHeavily indebted poor countries (HIPC)High incomeHondurasHong Kong SAR, ChinaHungaryIBRD onlyIcelandIDA & IBRD totalIDA blendIDA onlyIDA totalIndiaIndonesiaIran, Islamic Rep.IraqIrelandIsraelItalyJamaicaJapanJordanKazakhstanKenyaKiribatiKorea, Dem. People’s Rep.Korea, Rep.KuwaitKyrgyz RepublicLao PDRLate-demographic dividendLatin America & Caribbean Latin America & Caribbean (excluding high income)Latin America & the Caribbean (IDA & IBRD countries)LatviaLeast developed countries: UN classificationLebanonLesothoLiberiaLibyaLiechtensteinLithuaniaLow & middle incomeLow incomeLower middle incomeLuxembourgMacao SAR, ChinaMacedonia, FYRMadagascarMalawiMalaysiaMaldivesMaliMaltaMarshall IslandsMauritaniaMauritiusMexicoMicronesia, Fed. Sts.Middle East & North AfricaMiddle East & North Africa (excluding high income)Middle East & North Africa (IDA & IBRD countries)Middle incomeMoldovaMonacoMongoliaMontenegroMoroccoMozambiqueMyanmarNamibiaNauruNepalNetherlandsNew ZealandNicaraguaNigerNigeriaNorth AmericaNorwayOECD membersOmanOther small statesPacific island small statesPakistanPalauPanamaPapua New GuineaParaguayPeruPhilippinesPolandPortugalPost-demographic dividendPre-demographic dividendPuerto RicoQatarRomaniaRussian FederationRwandaSamoaSan MarinoSao Tome and PrincipeSaudi ArabiaSenegalSerbiaSeychellesSierra LeoneSingaporeSint Maarten (Dutch part)Slovak RepublicSloveniaSmall statesSolomon IslandsSomaliaSouth AfricaSouth AsiaSouth Asia (IDA & IBRD)South SudanSpainSri LankaSt. Kitts and NevisSt. LuciaSt. Vincent and the GrenadinesSub-Saharan Africa Sub-Saharan Africa (excluding high income)Sub-Saharan Africa (IDA & IBRD countries)SudanSurinameSwazilandSwedenSwitzerlandSyrian Arab RepublicTajikistanTanzaniaThailandTimor-LesteTogoTongaTrinidad and TobagoTunisiaTurkeyTurkmenistanTurks and Caicos IslandsTuvaluUgandaUkraineUnited Arab EmiratesUnited KingdomUnited StatesUpper middle incomeUruguayUzbekistanVanuatuVenezuela, RBVietnamWest Bank and GazaWorldYemen, Rep.ZambiaZimbabwe Timeline:
This timeline shows a graph from 1972 to 2015 of Madagascar. No data until 1971. Number of actual observations by date: 40.
Source name:
World Development Indicators
Source organization:
United Nations Educational, Scientific, and Cultural Organization (UNESCO) Institute for Statistics.
Categories, topics:
Education, Gender
Last updated:
apr 23, 2017
Indicators value changes by year
Minimum:
43.457
jan 1, 1977
Maximum:
50.828
jan 1, 1996
At the date of observation
Value
Absolute change
Change from previous value
jan 1, 1972
46.173
+46.173
0.0%
jan 1, 1973
46.221
+0.048
0.1%
jan 1, 1974
46.465
+0.244
0.53%
jan 1, 1975
46.298
-0.167
-0.36%
jan 1, 1976
46.873
+0.575
1.24%
jan 1, 1977
43.457
-3.416
-7.29%
jan 1, 1978
45.171
+1.714
3.94%
jan 1, 1979
47.448
+2.277
5.04%
jan 1, 1980
47.054
-0.394
-0.83%
jan 1, 1981
47.778
+0.725
1.54%
jan 1, 1982
49.01
+1.231
2.58%
jan 1, 1983
49.038
+0.028
0.06%
jan 1, 1984
46.827
-2.211
-4.51%
jan 1, 1986
48.222
+1.395
2.98%
jan 1, 1989
48.505
+0.283
0.59%
jan 1, 1990
48.615
+0.11
0.23%
jan 1, 1991
48.81
+0.195
0.4%
jan 1, 1992
49.264
+0.454
0.93%
jan 1, 1993
47.655
-1.608
-3.26%
jan 1, 1994
48.742
+1.087
2.28%
jan 1, 1995
49.024
+0.281
0.58%
jan 1, 1996
50.828
+1.805
3.68%
jan 1, 1997
48.937
-1.891
-3.72%
jan 1, 1999
48.988
+0.051
0.1%
jan 1, 2000
49.102
+0.114
0.23%
jan 1, 2001
48.997
-0.105
-0.21%
jan 1, 2002
49.03
+0.033
0.07%
jan 1, 2003
49.03
0.0
0.0%
jan 1, 2004
48.946
-0.084
-0.17%
jan 1, 2005
48.948
+0.002
0.0%
jan 1, 2006
48.905
-0.043
-0.09%
jan 1, 2007
49.018
+0.113
0.23%
jan 1, 2008
49.164
+0.146
0.3%
jan 1, 2009
49.222
+0.058
0.12%
jan 1, 2010
49.356
+0.134
0.27%
jan 1, 2011
49.429
+0.073
0.15%
jan 1, 2012
49.375
-0.054
-0.11%
jan 1, 2013
49.486
+0.111
0.22%
jan 1, 2014
49.583
+0.097
0.2%
jan 1, 2015
49.667
+0.085
0.17%
Ranking of countries by current statistics by years


Comments: