29
/
en
AIzaSyAYiBZKx7MnpbEhh9jyipgxe19OcubqV5w
April 1, 2024
207354
Nepal
NPL
true
2
1
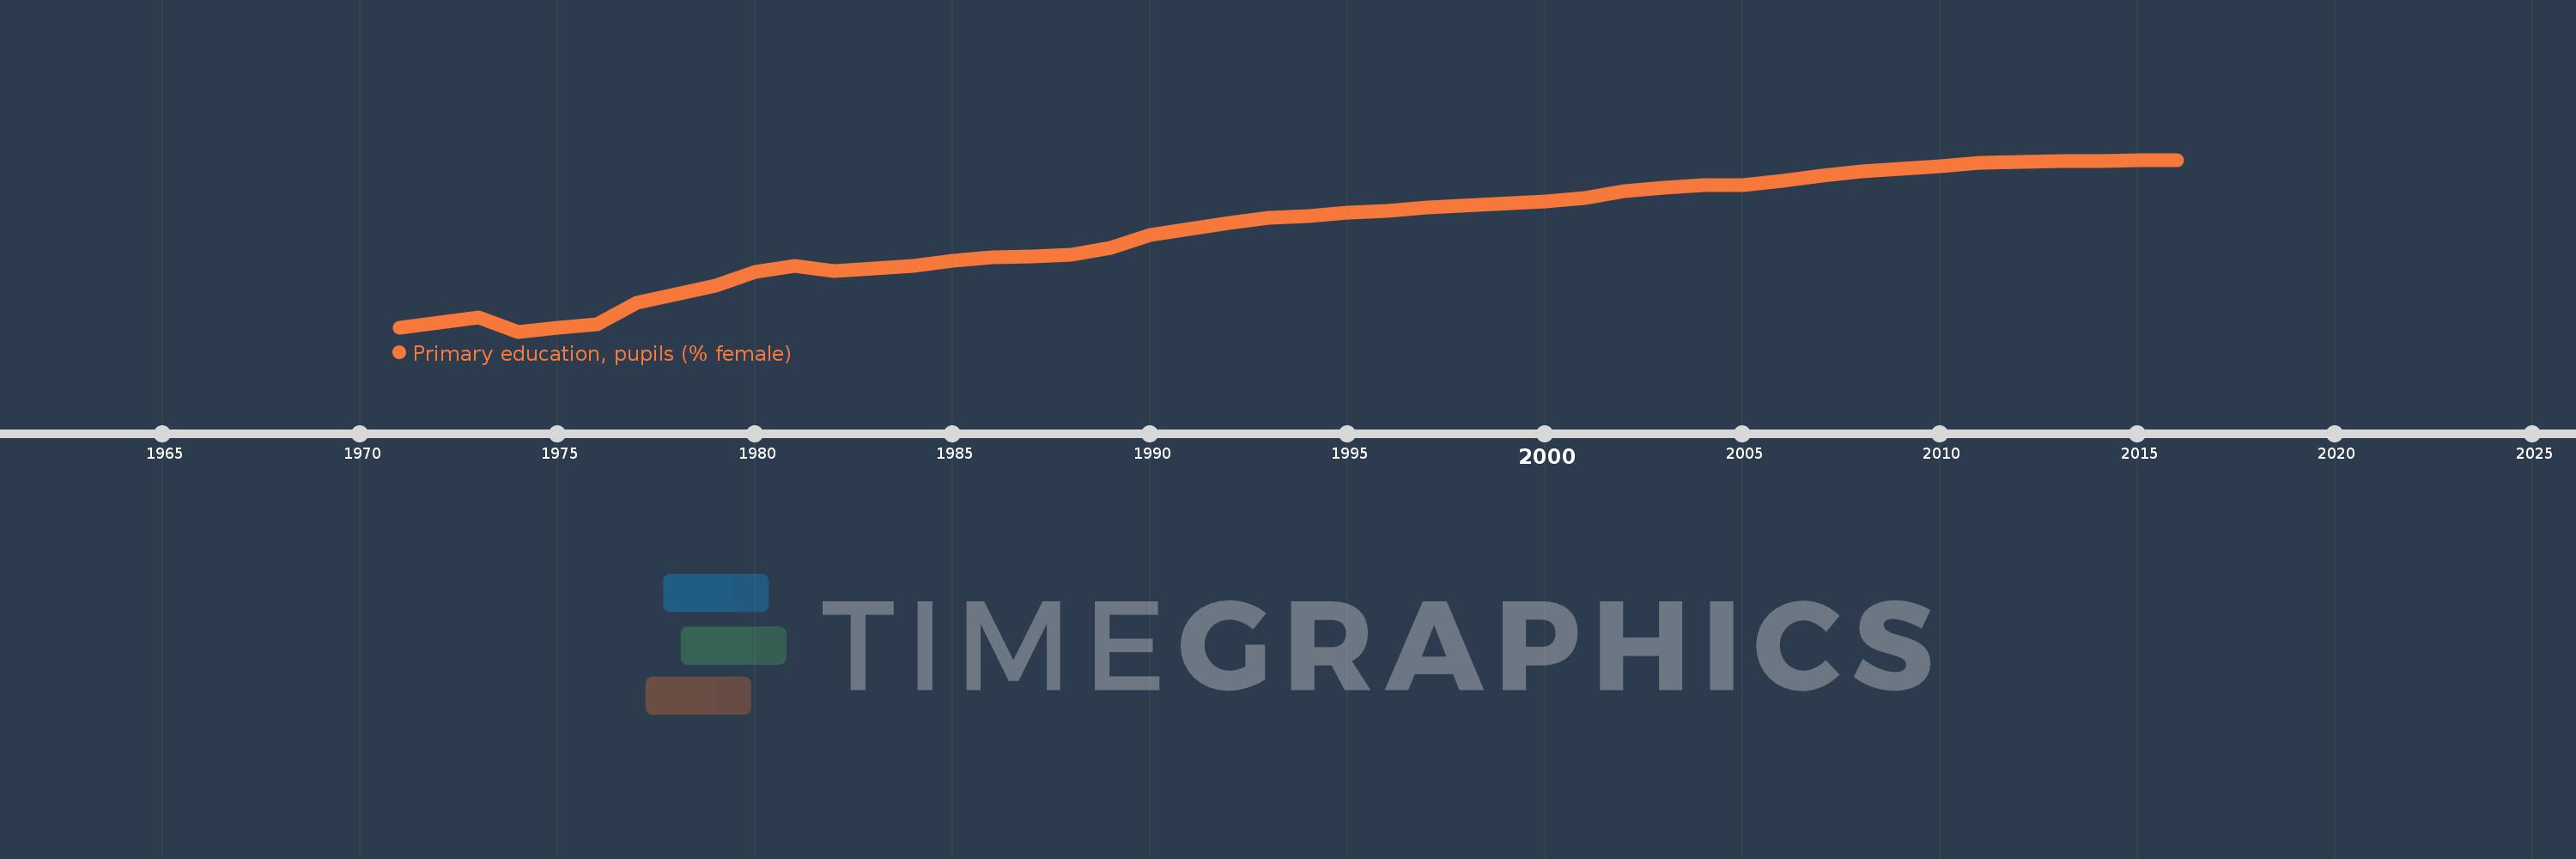
Primary education, pupils (% female)
2016,2015,2014,2013,2012,2011,2010,2009,2008,2007,2006,2005,2004,2003,2002,2001,2000,1997,1996,1995,1994,1993,1992,1991,1990,1989,1988,1987,1986,1985,1984,1983,1982,1981,1980,1979,1978,1977,1976,1975,1974,1973,1971
This statistics in other country:
AfghanistanAlbaniaAlgeriaAndorraAngolaAntigua and BarbudaArab WorldArgentinaArmeniaArubaAustraliaAustriaAzerbaijanBahamas, TheBahrainBangladeshBarbadosBelarusBelgiumBelizeBeninBermudaBhutanBoliviaBosnia and HerzegovinaBotswanaBrazilBritish Virgin IslandsBrunei DarussalamBulgariaBurkina FasoBurundiCabo VerdeCambodiaCameroonCanadaCaribbean small statesCayman IslandsCentral African RepublicCentral Europe and the BalticsChadChileChinaColombiaComorosCongo, Dem. Rep.Congo, Rep.Costa RicaCote d'IvoireCroatiaCubaCuracaoCyprusCzech RepublicDenmarkDjiboutiDominicaDominican RepublicEarly-demographic dividendEast Asia & PacificEast Asia & Pacific (excluding high income)East Asia & Pacific (IDA & IBRD countries)EcuadorEgypt, Arab Rep.El SalvadorEquatorial GuineaEritreaEstoniaEthiopiaEuro areaEurope & Central AsiaEurope & Central Asia (excluding high income)Europe & Central Asia (IDA & IBRD countries)European UnionFijiFinlandFragile and conflict affected situationsFranceGabonGambia, TheGeorgiaGermanyGhanaGibraltarGreeceGrenadaGuatemalaGuineaGuinea-BissauGuyanaHaitiHeavily indebted poor countries (HIPC)High incomeHondurasHong Kong SAR, ChinaHungaryIBRD onlyIcelandIDA & IBRD totalIDA blendIDA onlyIDA totalIndiaIndonesiaIran, Islamic Rep.IraqIrelandIsraelItalyJamaicaJapanJordanKazakhstanKenyaKiribatiKorea, Dem. People’s Rep.Korea, Rep.KuwaitKyrgyz RepublicLao PDRLate-demographic dividendLatin America & Caribbean Latin America & Caribbean (excluding high income)Latin America & the Caribbean (IDA & IBRD countries)LatviaLeast developed countries: UN classificationLebanonLesothoLiberiaLibyaLiechtensteinLithuaniaLow & middle incomeLow incomeLower middle incomeLuxembourgMacao SAR, ChinaMacedonia, FYRMadagascarMalawiMalaysiaMaldivesMaliMaltaMarshall IslandsMauritaniaMauritiusMexicoMicronesia, Fed. Sts.Middle East & North AfricaMiddle East & North Africa (excluding high income)Middle East & North Africa (IDA & IBRD countries)Middle incomeMoldovaMonacoMongoliaMontenegroMoroccoMozambiqueMyanmarNamibiaNauruNepalNetherlandsNew ZealandNicaraguaNigerNigeriaNorth AmericaNorwayOECD membersOmanOther small statesPacific island small statesPakistanPalauPanamaPapua New GuineaParaguayPeruPhilippinesPolandPortugalPost-demographic dividendPre-demographic dividendPuerto RicoQatarRomaniaRussian FederationRwandaSamoaSan MarinoSao Tome and PrincipeSaudi ArabiaSenegalSerbiaSeychellesSierra LeoneSingaporeSint Maarten (Dutch part)Slovak RepublicSloveniaSmall statesSolomon IslandsSomaliaSouth AfricaSouth AsiaSouth Asia (IDA & IBRD)South SudanSpainSri LankaSt. Kitts and NevisSt. LuciaSt. Vincent and the GrenadinesSub-Saharan Africa Sub-Saharan Africa (excluding high income)Sub-Saharan Africa (IDA & IBRD countries)SudanSurinameSwazilandSwedenSwitzerlandSyrian Arab RepublicTajikistanTanzaniaThailandTimor-LesteTogoTongaTrinidad and TobagoTunisiaTurkeyTurkmenistanTurks and Caicos IslandsTuvaluUgandaUkraineUnited Arab EmiratesUnited KingdomUnited StatesUpper middle incomeUruguayUzbekistanVanuatuVenezuela, RBVietnamWest Bank and GazaWorldYemen, Rep.ZambiaZimbabwe Timeline:
This timeline shows a graph from 1971 to 2016 of Nepal. No data until 1970. Number of actual observations by date: 43.
Source name:
World Development Indicators
Source organization:
United Nations Educational, Scientific, and Cultural Organization (UNESCO) Institute for Statistics.
Categories, topics:
Education, Gender
Last updated:
apr 23, 2017
Indicators value changes by year
Maximum:
50.776
jan 1, 2016
At the date of observation
Value
Absolute change
Change from previous value
jan 1, 1971
14.902
+14.902
0.0%
jan 1, 1973
17.06
+2.158
14.48%
jan 1, 1974
14.0
-3.06
-17.94%
jan 1, 1975
14.74
+0.74
5.28%
jan 1, 1976
15.485
+0.745
5.05%
jan 1, 1977
20.079
+4.594
29.67%
jan 1, 1978
22.058
+1.979
9.86%
jan 1, 1979
23.771
+1.713
7.77%
jan 1, 1980
26.739
+2.968
12.48%
jan 1, 1981
28.047
+1.308
4.89%
jan 1, 1982
26.926
-1.12
-3.99%
jan 1, 1983
27.592
+0.665
2.47%
jan 1, 1984
28.002
+0.41
1.49%
jan 1, 1985
29.211
+1.21
4.32%
jan 1, 1986
29.891
+0.679
2.33%
jan 1, 1987
30.118
+0.227
0.76%
jan 1, 1988
30.54
+0.423
1.4%
jan 1, 1989
31.838
+1.298
4.25%
jan 1, 1990
34.647
+2.809
8.82%
jan 1, 1991
35.996
+1.349
3.89%
jan 1, 1992
37.213
+1.216
3.38%
jan 1, 1993
38.284
+1.071
2.88%
jan 1, 1994
38.682
+0.398
1.04%
jan 1, 1995
39.427
+0.745
1.93%
jan 1, 1996
39.89
+0.463
1.18%
jan 1, 1997
40.647
+0.757
1.9%
jan 1, 2000
41.913
+1.267
3.12%
jan 1, 2001
42.624
+0.711
1.7%
jan 1, 2002
44.093
+1.469
3.45%
jan 1, 2003
44.796
+0.702
1.59%
jan 1, 2004
45.393
+0.598
1.33%
jan 1, 2005
45.398
+0.005
0.01%
jan 1, 2006
46.278
+0.88
1.94%
jan 1, 2007
47.408
+1.13
2.44%
jan 1, 2008
48.31
+0.902
1.9%
jan 1, 2009
48.878
+0.567
1.17%
jan 1, 2010
49.461
+0.583
1.19%
jan 1, 2011
50.074
+0.613
1.24%
jan 1, 2012
50.373
+0.3
0.6%
jan 1, 2013
50.427
+0.053
0.11%
jan 1, 2014
50.472
+0.046
0.09%
jan 1, 2015
50.659
+0.187
0.37%
jan 1, 2016
50.776
+0.116
0.23%
Ranking of countries by current statistics by years


Comments: