29
/
en
AIzaSyAYiBZKx7MnpbEhh9jyipgxe19OcubqV5w
April 1, 2024
261521
Tanzania
TZA
true
2
1
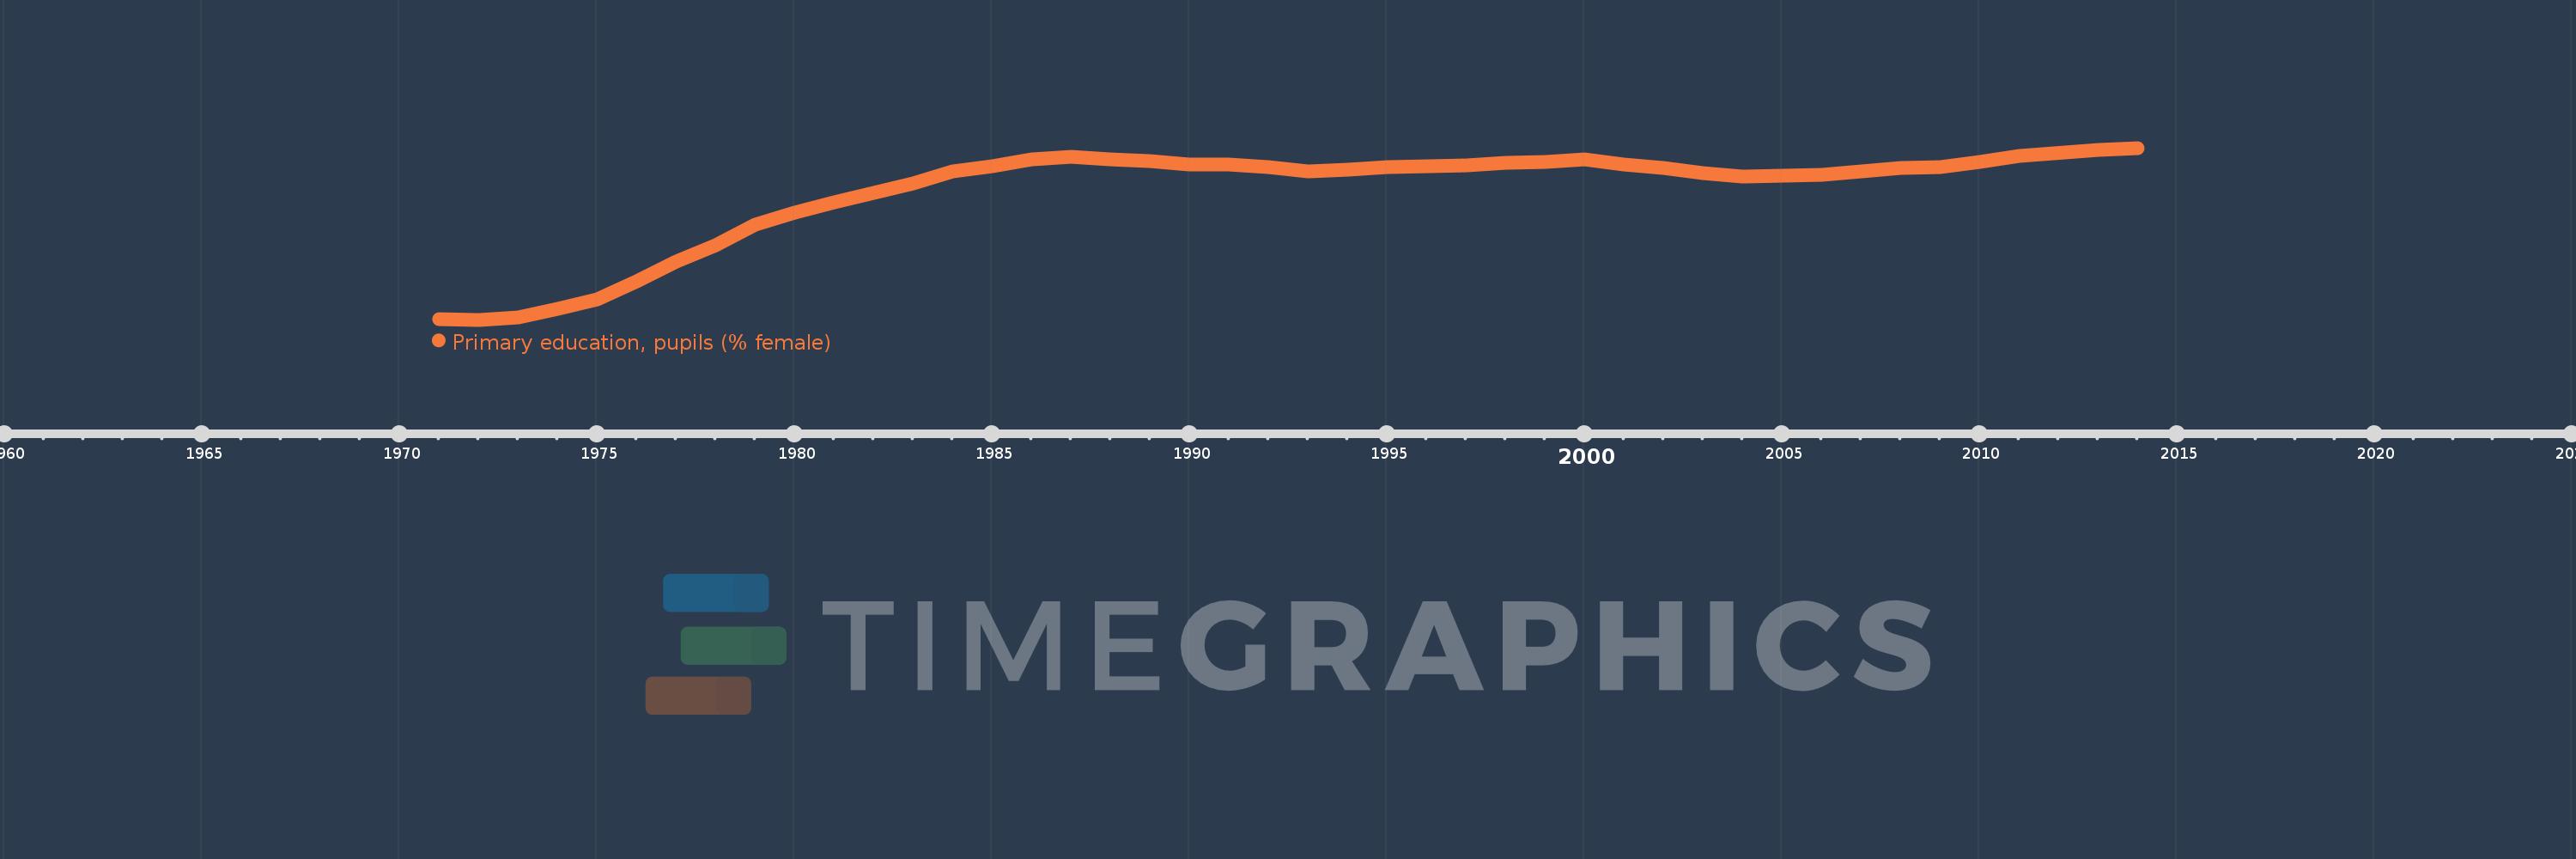
Primary education, pupils (% female)
2014,2013,2011,2010,2009,2008,2007,2006,2005,2004,2003,2002,2001,2000,1999,1998,1997,1996,1995,1994,1993,1992,1991,1990,1989,1988,1987,1986,1985,1984,1983,1982,1981,1980,1979,1978,1977,1976,1975,1974,1973,1972,1971
This statistics in other country:
AfghanistanAlbaniaAlgeriaAndorraAngolaAntigua and BarbudaArab WorldArgentinaArmeniaArubaAustraliaAustriaAzerbaijanBahamas, TheBahrainBangladeshBarbadosBelarusBelgiumBelizeBeninBermudaBhutanBoliviaBosnia and HerzegovinaBotswanaBrazilBritish Virgin IslandsBrunei DarussalamBulgariaBurkina FasoBurundiCabo VerdeCambodiaCameroonCanadaCaribbean small statesCayman IslandsCentral African RepublicCentral Europe and the BalticsChadChileChinaColombiaComorosCongo, Dem. Rep.Congo, Rep.Costa RicaCote d'IvoireCroatiaCubaCuracaoCyprusCzech RepublicDenmarkDjiboutiDominicaDominican RepublicEarly-demographic dividendEast Asia & PacificEast Asia & Pacific (excluding high income)East Asia & Pacific (IDA & IBRD countries)EcuadorEgypt, Arab Rep.El SalvadorEquatorial GuineaEritreaEstoniaEthiopiaEuro areaEurope & Central AsiaEurope & Central Asia (excluding high income)Europe & Central Asia (IDA & IBRD countries)European UnionFijiFinlandFragile and conflict affected situationsFranceGabonGambia, TheGeorgiaGermanyGhanaGibraltarGreeceGrenadaGuatemalaGuineaGuinea-BissauGuyanaHaitiHeavily indebted poor countries (HIPC)High incomeHondurasHong Kong SAR, ChinaHungaryIBRD onlyIcelandIDA & IBRD totalIDA blendIDA onlyIDA totalIndiaIndonesiaIran, Islamic Rep.IraqIrelandIsraelItalyJamaicaJapanJordanKazakhstanKenyaKiribatiKorea, Dem. People’s Rep.Korea, Rep.KuwaitKyrgyz RepublicLao PDRLate-demographic dividendLatin America & Caribbean Latin America & Caribbean (excluding high income)Latin America & the Caribbean (IDA & IBRD countries)LatviaLeast developed countries: UN classificationLebanonLesothoLiberiaLibyaLiechtensteinLithuaniaLow & middle incomeLow incomeLower middle incomeLuxembourgMacao SAR, ChinaMacedonia, FYRMadagascarMalawiMalaysiaMaldivesMaliMaltaMarshall IslandsMauritaniaMauritiusMexicoMicronesia, Fed. Sts.Middle East & North AfricaMiddle East & North Africa (excluding high income)Middle East & North Africa (IDA & IBRD countries)Middle incomeMoldovaMonacoMongoliaMontenegroMoroccoMozambiqueMyanmarNamibiaNauruNepalNetherlandsNew ZealandNicaraguaNigerNigeriaNorth AmericaNorwayOECD membersOmanOther small statesPacific island small statesPakistanPalauPanamaPapua New GuineaParaguayPeruPhilippinesPolandPortugalPost-demographic dividendPre-demographic dividendPuerto RicoQatarRomaniaRussian FederationRwandaSamoaSan MarinoSao Tome and PrincipeSaudi ArabiaSenegalSerbiaSeychellesSierra LeoneSingaporeSint Maarten (Dutch part)Slovak RepublicSloveniaSmall statesSolomon IslandsSomaliaSouth AfricaSouth AsiaSouth Asia (IDA & IBRD)South SudanSpainSri LankaSt. Kitts and NevisSt. LuciaSt. Vincent and the GrenadinesSub-Saharan Africa Sub-Saharan Africa (excluding high income)Sub-Saharan Africa (IDA & IBRD countries)SudanSurinameSwazilandSwedenSwitzerlandSyrian Arab RepublicTajikistanTanzaniaThailandTimor-LesteTogoTongaTrinidad and TobagoTunisiaTurkeyTurkmenistanTurks and Caicos IslandsTuvaluUgandaUkraineUnited Arab EmiratesUnited KingdomUnited StatesUpper middle incomeUruguayUzbekistanVanuatuVenezuela, RBVietnamWest Bank and GazaWorldYemen, Rep.ZambiaZimbabwe Timeline:
This timeline shows a graph from 1971 to 2014 of Tanzania. No data until 1970. Number of actual observations by date: 43.
Source name:
World Development Indicators
Source organization:
United Nations Educational, Scientific, and Cultural Organization (UNESCO) Institute for Statistics.
Categories, topics:
Education, Gender
Last updated:
apr 23, 2017
Indicators value changes by year
Minimum:
39.441
jan 1, 1972
Maximum:
50.603
jan 1, 2014
At the date of observation
Value
Absolute change
Change from previous value
jan 1, 1971
39.454
+39.454
0.0%
jan 1, 1972
39.441
-0.014
-0.03%
jan 1, 1973
39.574
+0.133
0.34%
jan 1, 1974
40.128
+0.554
1.4%
jan 1, 1975
40.79
+0.662
1.65%
jan 1, 1976
41.956
+1.166
2.86%
jan 1, 1977
43.194
+1.237
2.95%
jan 1, 1978
44.274
+1.08
2.5%
jan 1, 1979
45.621
+1.347
3.04%
jan 1, 1980
46.413
+0.792
1.74%
jan 1, 1981
47.07
+0.656
1.41%
jan 1, 1982
47.686
+0.617
1.31%
jan 1, 1983
48.32
+0.634
1.33%
jan 1, 1984
49.074
+0.753
1.56%
jan 1, 1985
49.397
+0.323
0.66%
jan 1, 1986
49.85
+0.453
0.92%
jan 1, 1987
50.047
+0.197
0.39%
jan 1, 1988
49.834
-0.213
-0.43%
jan 1, 1989
49.743
-0.091
-0.18%
jan 1, 1990
49.549
-0.195
-0.39%
jan 1, 1991
49.534
-0.014
-0.03%
jan 1, 1992
49.369
-0.165
-0.33%
jan 1, 1993
49.107
-0.262
-0.53%
jan 1, 1994
49.172
+0.065
0.13%
jan 1, 1995
49.351
+0.179
0.36%
jan 1, 1996
49.405
+0.055
0.11%
jan 1, 1997
49.46
+0.055
0.11%
jan 1, 1998
49.628
+0.168
0.34%
jan 1, 1999
49.703
+0.076
0.15%
jan 1, 2000
49.887
+0.183
0.37%
jan 1, 2001
49.515
-0.372
-0.75%
jan 1, 2002
49.313
-0.202
-0.41%
jan 1, 2003
48.974
-0.338
-0.69%
jan 1, 2004
48.72
-0.255
-0.52%
jan 1, 2005
48.804
+0.085
0.17%
jan 1, 2006
48.871
+0.067
0.14%
jan 1, 2007
49.099
+0.227
0.47%
jan 1, 2008
49.318
+0.219
0.45%
jan 1, 2009
49.345
+0.026
0.05%
jan 1, 2010
49.668
+0.324
0.66%
jan 1, 2011
50.076
+0.407
0.82%
jan 1, 2013
50.452
+0.377
0.75%
jan 1, 2014
50.603
+0.151
0.3%
Ranking of countries by current statistics by years


Comments: