29
/
en
AIzaSyAYiBZKx7MnpbEhh9jyipgxe19OcubqV5w
April 1, 2024
111537
Congo, Rep.
COG
true
2
1
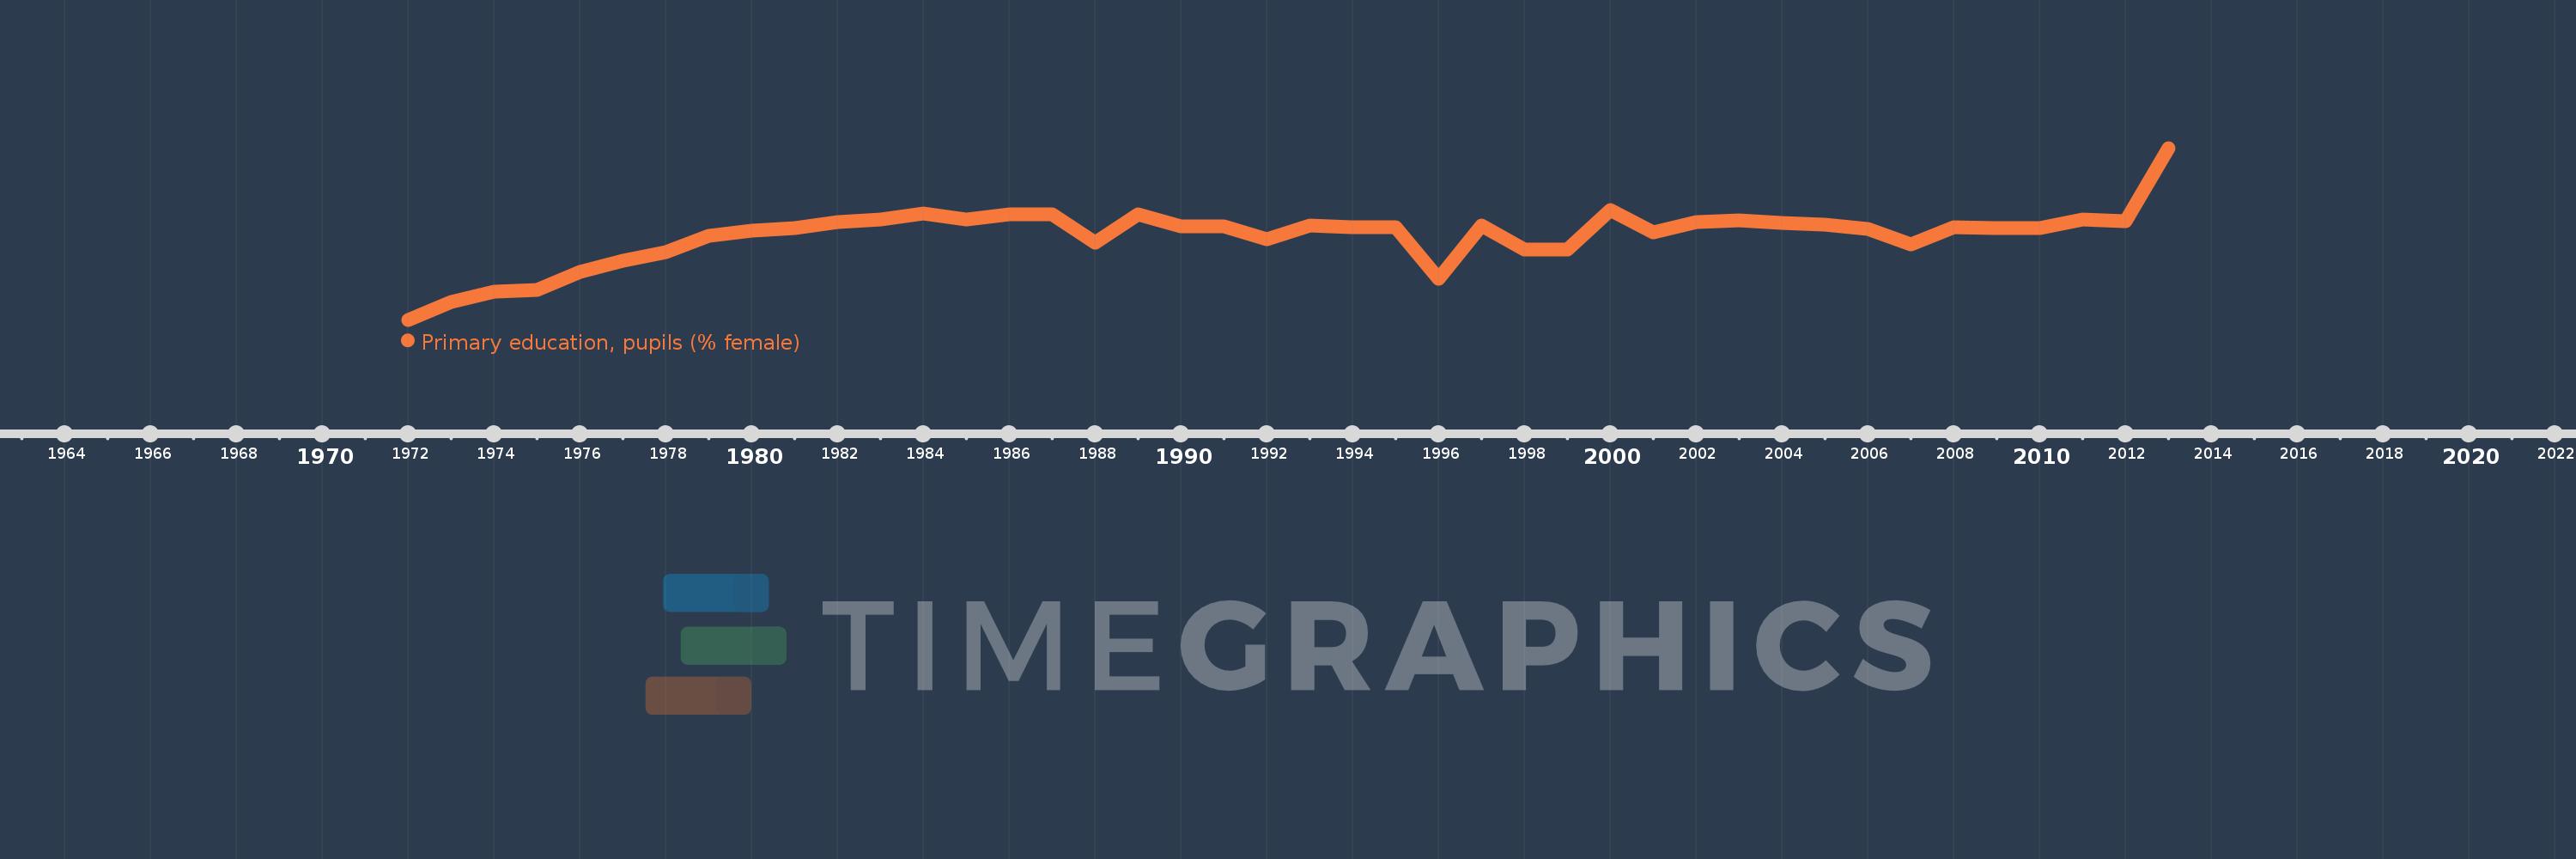
Primary education, pupils (% female)
2013,2012,2011,2010,2009,2008,2007,2006,2005,2004,2003,2002,2001,2000,1999,1998,1997,1996,1995,1994,1993,1992,1991,1990,1989,1988,1987,1986,1985,1984,1983,1982,1981,1980,1979,1978,1977,1976,1975,1974,1973,1972
This statistics in other country:
AfghanistanAlbaniaAlgeriaAndorraAngolaAntigua and BarbudaArab WorldArgentinaArmeniaArubaAustraliaAustriaAzerbaijanBahamas, TheBahrainBangladeshBarbadosBelarusBelgiumBelizeBeninBermudaBhutanBoliviaBosnia and HerzegovinaBotswanaBrazilBritish Virgin IslandsBrunei DarussalamBulgariaBurkina FasoBurundiCabo VerdeCambodiaCameroonCanadaCaribbean small statesCayman IslandsCentral African RepublicCentral Europe and the BalticsChadChileChinaColombiaComorosCongo, Dem. Rep.Congo, Rep.Costa RicaCote d'IvoireCroatiaCubaCuracaoCyprusCzech RepublicDenmarkDjiboutiDominicaDominican RepublicEarly-demographic dividendEast Asia & PacificEast Asia & Pacific (excluding high income)East Asia & Pacific (IDA & IBRD countries)EcuadorEgypt, Arab Rep.El SalvadorEquatorial GuineaEritreaEstoniaEthiopiaEuro areaEurope & Central AsiaEurope & Central Asia (excluding high income)Europe & Central Asia (IDA & IBRD countries)European UnionFijiFinlandFragile and conflict affected situationsFranceGabonGambia, TheGeorgiaGermanyGhanaGibraltarGreeceGrenadaGuatemalaGuineaGuinea-BissauGuyanaHaitiHeavily indebted poor countries (HIPC)High incomeHondurasHong Kong SAR, ChinaHungaryIBRD onlyIcelandIDA & IBRD totalIDA blendIDA onlyIDA totalIndiaIndonesiaIran, Islamic Rep.IraqIrelandIsraelItalyJamaicaJapanJordanKazakhstanKenyaKiribatiKorea, Dem. People’s Rep.Korea, Rep.KuwaitKyrgyz RepublicLao PDRLate-demographic dividendLatin America & Caribbean Latin America & Caribbean (excluding high income)Latin America & the Caribbean (IDA & IBRD countries)LatviaLeast developed countries: UN classificationLebanonLesothoLiberiaLibyaLiechtensteinLithuaniaLow & middle incomeLow incomeLower middle incomeLuxembourgMacao SAR, ChinaMacedonia, FYRMadagascarMalawiMalaysiaMaldivesMaliMaltaMarshall IslandsMauritaniaMauritiusMexicoMicronesia, Fed. Sts.Middle East & North AfricaMiddle East & North Africa (excluding high income)Middle East & North Africa (IDA & IBRD countries)Middle incomeMoldovaMonacoMongoliaMontenegroMoroccoMozambiqueMyanmarNamibiaNauruNepalNetherlandsNew ZealandNicaraguaNigerNigeriaNorth AmericaNorwayOECD membersOmanOther small statesPacific island small statesPakistanPalauPanamaPapua New GuineaParaguayPeruPhilippinesPolandPortugalPost-demographic dividendPre-demographic dividendPuerto RicoQatarRomaniaRussian FederationRwandaSamoaSan MarinoSao Tome and PrincipeSaudi ArabiaSenegalSerbiaSeychellesSierra LeoneSingaporeSint Maarten (Dutch part)Slovak RepublicSloveniaSmall statesSolomon IslandsSomaliaSouth AfricaSouth AsiaSouth Asia (IDA & IBRD)South SudanSpainSri LankaSt. Kitts and NevisSt. LuciaSt. Vincent and the GrenadinesSub-Saharan Africa Sub-Saharan Africa (excluding high income)Sub-Saharan Africa (IDA & IBRD countries)SudanSurinameSwazilandSwedenSwitzerlandSyrian Arab RepublicTajikistanTanzaniaThailandTimor-LesteTogoTongaTrinidad and TobagoTunisiaTurkeyTurkmenistanTurks and Caicos IslandsTuvaluUgandaUkraineUnited Arab EmiratesUnited KingdomUnited StatesUpper middle incomeUruguayUzbekistanVanuatuVenezuela, RBVietnamWest Bank and GazaWorldYemen, Rep.ZambiaZimbabwe Timeline:
This timeline shows a graph from 1972 to 2013 of Congo, Rep.. No data until 1971. Number of actual observations by date: 42.
Source name:
World Development Indicators
Source organization:
United Nations Educational, Scientific, and Cultural Organization (UNESCO) Institute for Statistics.
Categories, topics:
Education, Gender
Last updated:
apr 23, 2017
Indicators value changes by year
Minimum:
43.919
jan 1, 1972
Maximum:
51.501
jan 1, 2013
At the date of observation
Value
Absolute change
Change from previous value
jan 1, 1972
43.919
+43.919
0.0%
jan 1, 1973
44.701
+0.782
1.78%
jan 1, 1974
45.155
+0.455
1.02%
jan 1, 1975
45.247
+0.091
0.2%
jan 1, 1976
46.04
+0.793
1.75%
jan 1, 1977
46.52
+0.48
1.04%
jan 1, 1978
46.884
+0.364
0.78%
jan 1, 1979
47.625
+0.741
1.58%
jan 1, 1980
47.832
+0.207
0.43%
jan 1, 1981
47.947
+0.116
0.24%
jan 1, 1982
48.232
+0.285
0.59%
jan 1, 1983
48.346
+0.114
0.24%
jan 1, 1984
48.598
+0.252
0.52%
jan 1, 1985
48.345
-0.253
-0.52%
jan 1, 1986
48.583
+0.238
0.49%
jan 1, 1987
48.562
-0.021
-0.04%
jan 1, 1988
47.317
-1.246
-2.57%
jan 1, 1989
48.589
+1.272
2.69%
jan 1, 1990
48.025
-0.564
-1.16%
jan 1, 1991
48.032
+0.007
0.01%
jan 1, 1992
47.473
-0.559
-1.16%
jan 1, 1993
48.095
+0.621
1.31%
jan 1, 1994
47.987
-0.108
-0.22%
jan 1, 1995
47.984
-0.003
-0.01%
jan 1, 1996
45.737
-2.247
-4.68%
jan 1, 1997
48.087
+2.35
5.14%
jan 1, 1998
47.0
-1.087
-2.26%
jan 1, 2000
48.763
+1.763
3.75%
jan 1, 2001
47.772
-0.991
-2.03%
jan 1, 2002
48.242
+0.47
0.98%
jan 1, 2003
48.299
+0.057
0.12%
jan 1, 2004
48.175
-0.124
-0.26%
jan 1, 2005
48.131
-0.044
-0.09%
jan 1, 2006
47.92
-0.212
-0.44%
jan 1, 2007
47.242
-0.677
-1.41%
jan 1, 2008
47.987
+0.745
1.58%
jan 1, 2009
47.979
-0.009
-0.02%
jan 1, 2010
47.973
-0.005
-0.01%
jan 1, 2011
48.328
+0.355
0.74%
jan 1, 2012
48.285
-0.043
-0.09%
jan 1, 2013
51.501
+3.216
6.66%
Ranking of countries by current statistics by years


Comments: