29
/
en
AIzaSyAYiBZKx7MnpbEhh9jyipgxe19OcubqV5w
April 1, 2024
159820
Ireland
IRL
true
2
1
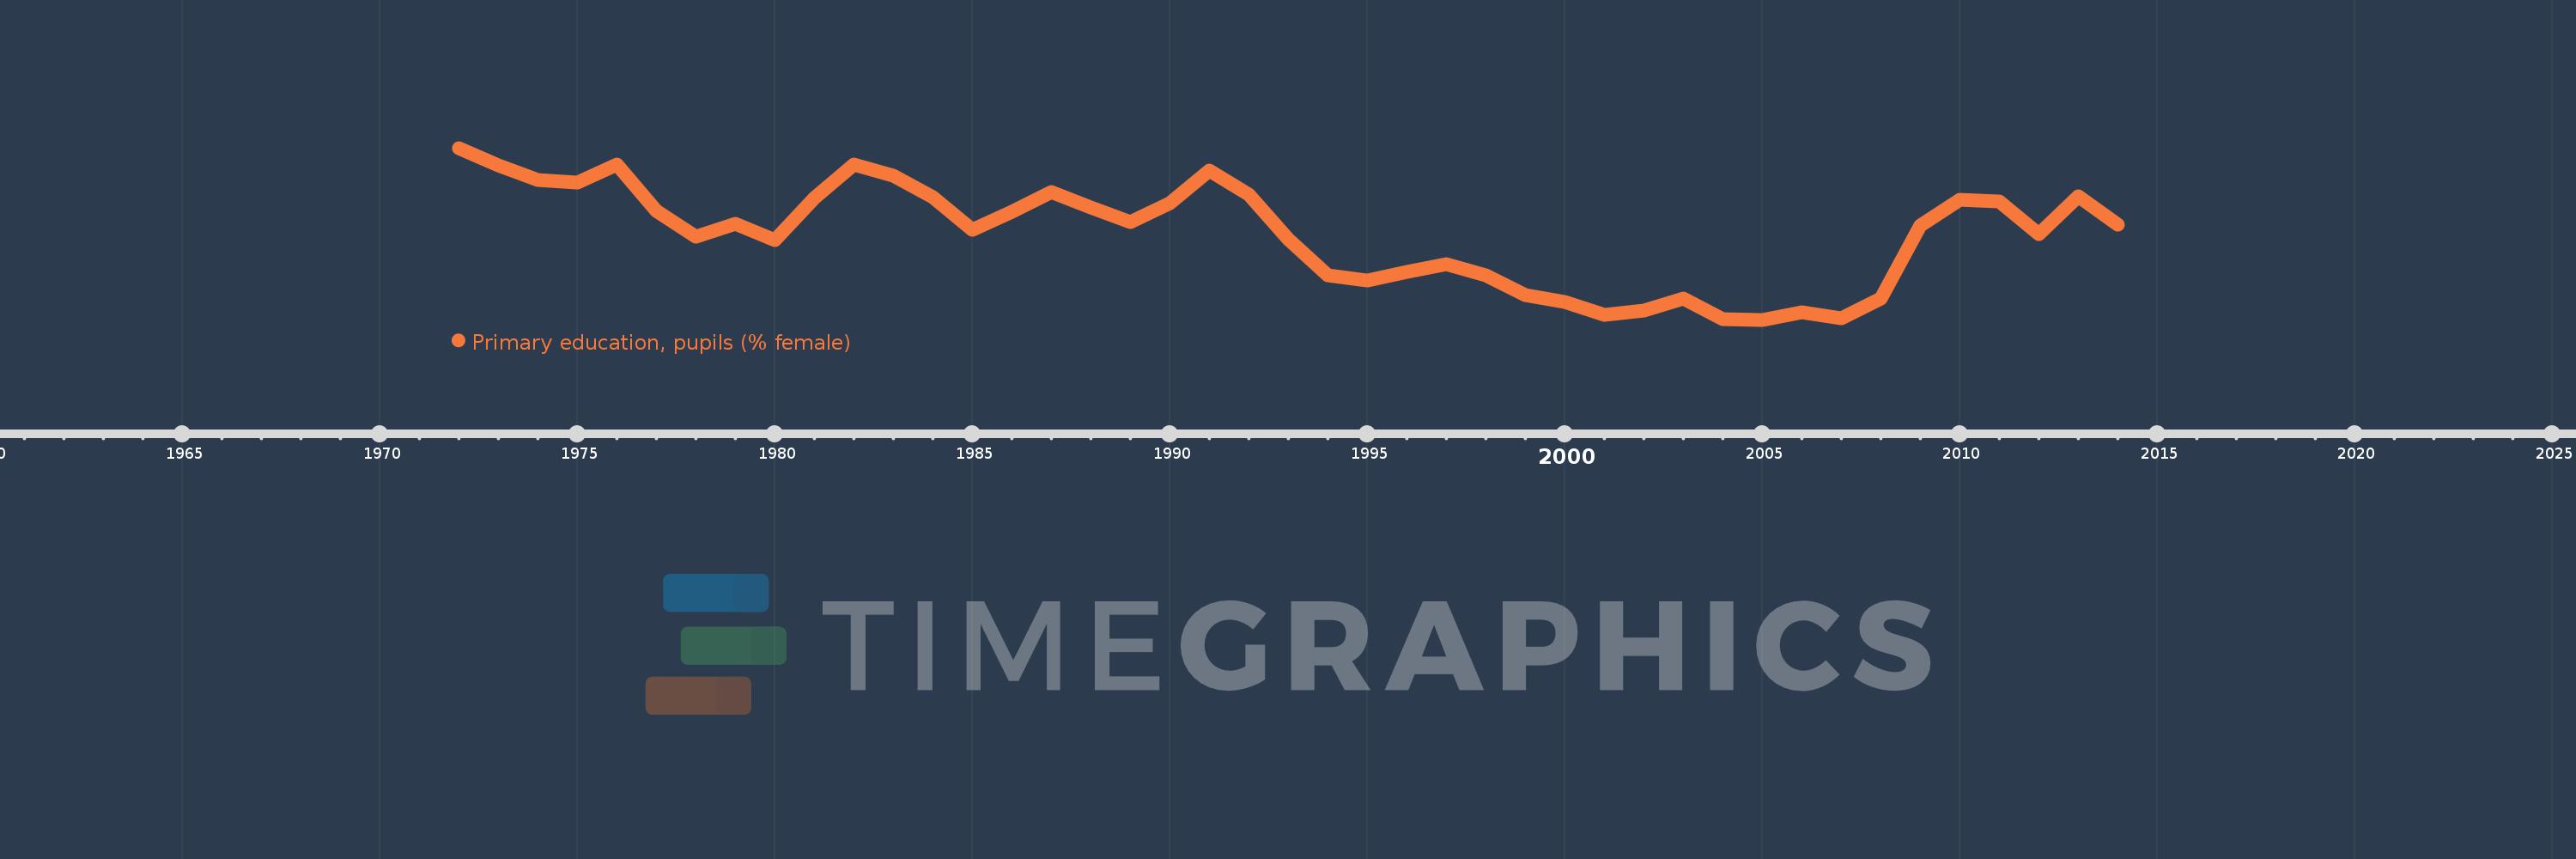
Primary education, pupils (% female)
2014,2013,2012,2011,2010,2009,2008,2007,2006,2005,2004,2003,2002,2001,2000,1999,1998,1997,1996,1995,1994,1993,1992,1991,1990,1989,1988,1987,1986,1985,1984,1983,1982,1981,1980,1979,1978,1977,1976,1975,1974,1973,1972
This statistics in other country:
AfghanistanAlbaniaAlgeriaAndorraAngolaAntigua and BarbudaArab WorldArgentinaArmeniaArubaAustraliaAustriaAzerbaijanBahamas, TheBahrainBangladeshBarbadosBelarusBelgiumBelizeBeninBermudaBhutanBoliviaBosnia and HerzegovinaBotswanaBrazilBritish Virgin IslandsBrunei DarussalamBulgariaBurkina FasoBurundiCabo VerdeCambodiaCameroonCanadaCaribbean small statesCayman IslandsCentral African RepublicCentral Europe and the BalticsChadChileChinaColombiaComorosCongo, Dem. Rep.Congo, Rep.Costa RicaCote d'IvoireCroatiaCubaCuracaoCyprusCzech RepublicDenmarkDjiboutiDominicaDominican RepublicEarly-demographic dividendEast Asia & PacificEast Asia & Pacific (excluding high income)East Asia & Pacific (IDA & IBRD countries)EcuadorEgypt, Arab Rep.El SalvadorEquatorial GuineaEritreaEstoniaEthiopiaEuro areaEurope & Central AsiaEurope & Central Asia (excluding high income)Europe & Central Asia (IDA & IBRD countries)European UnionFijiFinlandFragile and conflict affected situationsFranceGabonGambia, TheGeorgiaGermanyGhanaGibraltarGreeceGrenadaGuatemalaGuineaGuinea-BissauGuyanaHaitiHeavily indebted poor countries (HIPC)High incomeHondurasHong Kong SAR, ChinaHungaryIBRD onlyIcelandIDA & IBRD totalIDA blendIDA onlyIDA totalIndiaIndonesiaIran, Islamic Rep.IraqIrelandIsraelItalyJamaicaJapanJordanKazakhstanKenyaKiribatiKorea, Dem. People’s Rep.Korea, Rep.KuwaitKyrgyz RepublicLao PDRLate-demographic dividendLatin America & Caribbean Latin America & Caribbean (excluding high income)Latin America & the Caribbean (IDA & IBRD countries)LatviaLeast developed countries: UN classificationLebanonLesothoLiberiaLibyaLiechtensteinLithuaniaLow & middle incomeLow incomeLower middle incomeLuxembourgMacao SAR, ChinaMacedonia, FYRMadagascarMalawiMalaysiaMaldivesMaliMaltaMarshall IslandsMauritaniaMauritiusMexicoMicronesia, Fed. Sts.Middle East & North AfricaMiddle East & North Africa (excluding high income)Middle East & North Africa (IDA & IBRD countries)Middle incomeMoldovaMonacoMongoliaMontenegroMoroccoMozambiqueMyanmarNamibiaNauruNepalNetherlandsNew ZealandNicaraguaNigerNigeriaNorth AmericaNorwayOECD membersOmanOther small statesPacific island small statesPakistanPalauPanamaPapua New GuineaParaguayPeruPhilippinesPolandPortugalPost-demographic dividendPre-demographic dividendPuerto RicoQatarRomaniaRussian FederationRwandaSamoaSan MarinoSao Tome and PrincipeSaudi ArabiaSenegalSerbiaSeychellesSierra LeoneSingaporeSint Maarten (Dutch part)Slovak RepublicSloveniaSmall statesSolomon IslandsSomaliaSouth AfricaSouth AsiaSouth Asia (IDA & IBRD)South SudanSpainSri LankaSt. Kitts and NevisSt. LuciaSt. Vincent and the GrenadinesSub-Saharan Africa Sub-Saharan Africa (excluding high income)Sub-Saharan Africa (IDA & IBRD countries)SudanSurinameSwazilandSwedenSwitzerlandSyrian Arab RepublicTajikistanTanzaniaThailandTimor-LesteTogoTongaTrinidad and TobagoTunisiaTurkeyTurkmenistanTurks and Caicos IslandsTuvaluUgandaUkraineUnited Arab EmiratesUnited KingdomUnited StatesUpper middle incomeUruguayUzbekistanVanuatuVenezuela, RBVietnamWest Bank and GazaWorldYemen, Rep.ZambiaZimbabwe Timeline:
This timeline shows a graph from 1972 to 2014 of Ireland. No data until 1971. Number of actual observations by date: 43.
Source name:
World Development Indicators
Source organization:
United Nations Educational, Scientific, and Cultural Organization (UNESCO) Institute for Statistics.
Categories, topics:
Education, Gender
Last updated:
apr 23, 2017
Indicators value changes by year
Maximum:
48.962
jan 1, 1972
At the date of observation
Value
Absolute change
Change from previous value
jan 1, 1972
48.962
+48.962
0.0%
jan 1, 1973
48.913
-0.048
-0.1%
jan 1, 1974
48.873
-0.04
-0.08%
jan 1, 1975
48.866
-0.007
-0.01%
jan 1, 1976
48.915
+0.049
0.1%
jan 1, 1977
48.785
-0.13
-0.26%
jan 1, 1978
48.713
-0.072
-0.15%
jan 1, 1979
48.749
+0.036
0.07%
jan 1, 1980
48.703
-0.045
-0.09%
jan 1, 1981
48.822
+0.118
0.24%
jan 1, 1982
48.916
+0.094
0.19%
jan 1, 1983
48.884
-0.032
-0.07%
jan 1, 1984
48.825
-0.059
-0.12%
jan 1, 1985
48.733
-0.092
-0.19%
jan 1, 1986
48.782
+0.049
0.1%
jan 1, 1987
48.838
+0.056
0.11%
jan 1, 1988
48.796
-0.042
-0.09%
jan 1, 1989
48.753
-0.043
-0.09%
jan 1, 1990
48.808
+0.055
0.11%
jan 1, 1991
48.898
+0.09
0.18%
jan 1, 1992
48.832
-0.066
-0.13%
jan 1, 1993
48.706
-0.126
-0.26%
jan 1, 1994
48.605
-0.101
-0.21%
jan 1, 1995
48.589
-0.016
-0.03%
jan 1, 1996
48.615
+0.026
0.05%
jan 1, 1997
48.635
+0.021
0.04%
jan 1, 1998
48.604
-0.031
-0.06%
jan 1, 1999
48.549
-0.055
-0.11%
jan 1, 2000
48.529
-0.02
-0.04%
jan 1, 2001
48.494
-0.035
-0.07%
jan 1, 2002
48.505
+0.011
0.02%
jan 1, 2003
48.54
+0.035
0.07%
jan 1, 2004
48.481
-0.059
-0.12%
jan 1, 2005
48.48
-0.001
0.0%
jan 1, 2006
48.502
+0.022
0.05%
jan 1, 2007
48.485
-0.017
-0.03%
jan 1, 2008
48.54
+0.055
0.11%
jan 1, 2009
48.745
+0.205
0.42%
jan 1, 2010
48.816
+0.071
0.15%
jan 1, 2011
48.811
-0.005
-0.01%
jan 1, 2012
48.72
-0.091
-0.19%
jan 1, 2013
48.826
+0.106
0.22%
jan 1, 2014
48.747
-0.079
-0.16%
Ranking of countries by current statistics by years


Comments: