29
/
en
AIzaSyAYiBZKx7MnpbEhh9jyipgxe19OcubqV5w
April 1, 2024
209702
New Zealand
NZL
true
2
1
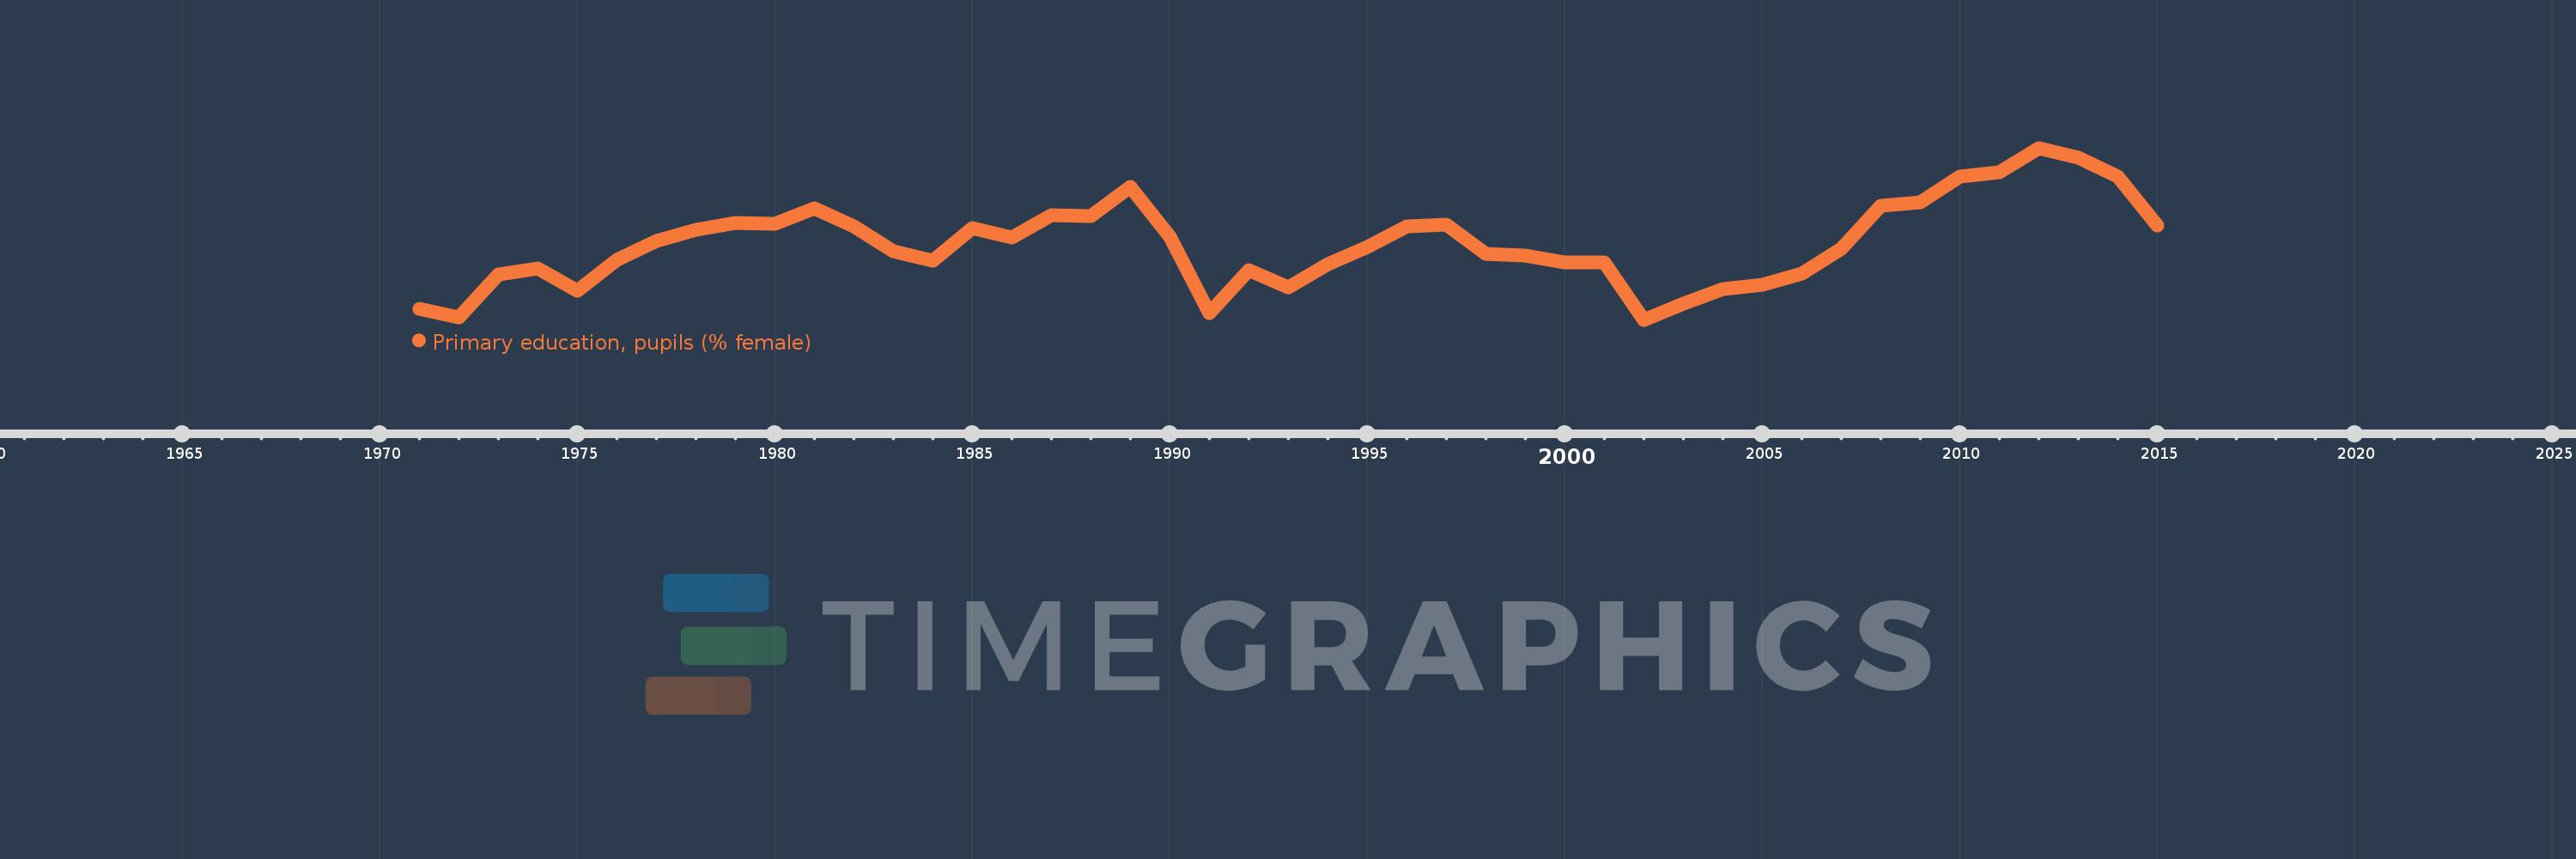
Primary education, pupils (% female)
2015,2014,2013,2012,2011,2010,2009,2008,2007,2006,2005,2004,2003,2002,2001,2000,1999,1998,1997,1996,1995,1994,1993,1992,1991,1990,1989,1988,1987,1986,1985,1984,1983,1982,1981,1980,1979,1978,1977,1976,1975,1974,1973,1972,1971
This statistics in other country:
AfghanistanAlbaniaAlgeriaAndorraAngolaAntigua and BarbudaArab WorldArgentinaArmeniaArubaAustraliaAustriaAzerbaijanBahamas, TheBahrainBangladeshBarbadosBelarusBelgiumBelizeBeninBermudaBhutanBoliviaBosnia and HerzegovinaBotswanaBrazilBritish Virgin IslandsBrunei DarussalamBulgariaBurkina FasoBurundiCabo VerdeCambodiaCameroonCanadaCaribbean small statesCayman IslandsCentral African RepublicCentral Europe and the BalticsChadChileChinaColombiaComorosCongo, Dem. Rep.Congo, Rep.Costa RicaCote d'IvoireCroatiaCubaCuracaoCyprusCzech RepublicDenmarkDjiboutiDominicaDominican RepublicEarly-demographic dividendEast Asia & PacificEast Asia & Pacific (excluding high income)East Asia & Pacific (IDA & IBRD countries)EcuadorEgypt, Arab Rep.El SalvadorEquatorial GuineaEritreaEstoniaEthiopiaEuro areaEurope & Central AsiaEurope & Central Asia (excluding high income)Europe & Central Asia (IDA & IBRD countries)European UnionFijiFinlandFragile and conflict affected situationsFranceGabonGambia, TheGeorgiaGermanyGhanaGibraltarGreeceGrenadaGuatemalaGuineaGuinea-BissauGuyanaHaitiHeavily indebted poor countries (HIPC)High incomeHondurasHong Kong SAR, ChinaHungaryIBRD onlyIcelandIDA & IBRD totalIDA blendIDA onlyIDA totalIndiaIndonesiaIran, Islamic Rep.IraqIrelandIsraelItalyJamaicaJapanJordanKazakhstanKenyaKiribatiKorea, Dem. People’s Rep.Korea, Rep.KuwaitKyrgyz RepublicLao PDRLate-demographic dividendLatin America & Caribbean Latin America & Caribbean (excluding high income)Latin America & the Caribbean (IDA & IBRD countries)LatviaLeast developed countries: UN classificationLebanonLesothoLiberiaLibyaLiechtensteinLithuaniaLow & middle incomeLow incomeLower middle incomeLuxembourgMacao SAR, ChinaMacedonia, FYRMadagascarMalawiMalaysiaMaldivesMaliMaltaMarshall IslandsMauritaniaMauritiusMexicoMicronesia, Fed. Sts.Middle East & North AfricaMiddle East & North Africa (excluding high income)Middle East & North Africa (IDA & IBRD countries)Middle incomeMoldovaMonacoMongoliaMontenegroMoroccoMozambiqueMyanmarNamibiaNauruNepalNetherlandsNew ZealandNicaraguaNigerNigeriaNorth AmericaNorwayOECD membersOmanOther small statesPacific island small statesPakistanPalauPanamaPapua New GuineaParaguayPeruPhilippinesPolandPortugalPost-demographic dividendPre-demographic dividendPuerto RicoQatarRomaniaRussian FederationRwandaSamoaSan MarinoSao Tome and PrincipeSaudi ArabiaSenegalSerbiaSeychellesSierra LeoneSingaporeSint Maarten (Dutch part)Slovak RepublicSloveniaSmall statesSolomon IslandsSomaliaSouth AfricaSouth AsiaSouth Asia (IDA & IBRD)South SudanSpainSri LankaSt. Kitts and NevisSt. LuciaSt. Vincent and the GrenadinesSub-Saharan Africa Sub-Saharan Africa (excluding high income)Sub-Saharan Africa (IDA & IBRD countries)SudanSurinameSwazilandSwedenSwitzerlandSyrian Arab RepublicTajikistanTanzaniaThailandTimor-LesteTogoTongaTrinidad and TobagoTunisiaTurkeyTurkmenistanTurks and Caicos IslandsTuvaluUgandaUkraineUnited Arab EmiratesUnited KingdomUnited StatesUpper middle incomeUruguayUzbekistanVanuatuVenezuela, RBVietnamWest Bank and GazaWorldYemen, Rep.ZambiaZimbabwe Timeline:
This timeline shows a graph from 1971 to 2015 of New Zealand. No data until 1970. Number of actual observations by date: 45.
Source name:
World Development Indicators
Source organization:
United Nations Educational, Scientific, and Cultural Organization (UNESCO) Institute for Statistics.
Categories, topics:
Education, Gender
Last updated:
apr 23, 2017
Indicators value changes by year
Minimum:
48.365
jan 1, 2002
Maximum:
48.943
jan 1, 2012
At the date of observation
Value
Absolute change
Change from previous value
jan 1, 1971
48.402
+48.402
0.0%
jan 1, 1972
48.372
-0.031
-0.06%
jan 1, 1973
48.518
+0.147
0.3%
jan 1, 1974
48.538
+0.019
0.04%
jan 1, 1975
48.461
-0.076
-0.16%
jan 1, 1976
48.566
+0.105
0.22%
jan 1, 1977
48.629
+0.063
0.13%
jan 1, 1978
48.669
+0.04
0.08%
jan 1, 1979
48.692
+0.023
0.05%
jan 1, 1980
48.689
-0.003
-0.01%
jan 1, 1981
48.739
+0.05
0.1%
jan 1, 1982
48.679
-0.06
-0.12%
jan 1, 1983
48.595
-0.084
-0.17%
jan 1, 1984
48.564
-0.031
-0.06%
jan 1, 1985
48.674
+0.111
0.23%
jan 1, 1986
48.642
-0.032
-0.07%
jan 1, 1987
48.717
+0.075
0.15%
jan 1, 1988
48.715
-0.001
0.0%
jan 1, 1989
48.811
+0.096
0.2%
jan 1, 1990
48.645
-0.167
-0.34%
jan 1, 1991
48.388
-0.257
-0.53%
jan 1, 1992
48.531
+0.143
0.29%
jan 1, 1993
48.475
-0.056
-0.12%
jan 1, 1994
48.553
+0.079
0.16%
jan 1, 1995
48.609
+0.056
0.12%
jan 1, 1996
48.679
+0.069
0.14%
jan 1, 1997
48.684
+0.005
0.01%
jan 1, 1998
48.586
-0.098
-0.2%
jan 1, 1999
48.582
-0.004
-0.01%
jan 1, 2000
48.557
-0.025
-0.05%
jan 1, 2001
48.559
+0.002
0.0%
jan 1, 2002
48.365
-0.194
-0.4%
jan 1, 2003
48.418
+0.053
0.11%
jan 1, 2004
48.468
+0.05
0.1%
jan 1, 2005
48.483
+0.015
0.03%
jan 1, 2006
48.52
+0.037
0.08%
jan 1, 2007
48.604
+0.084
0.17%
jan 1, 2008
48.748
+0.145
0.3%
jan 1, 2009
48.76
+0.012
0.02%
jan 1, 2010
48.847
+0.087
0.18%
jan 1, 2011
48.861
+0.014
0.03%
jan 1, 2012
48.943
+0.082
0.17%
jan 1, 2013
48.91
-0.033
-0.07%
jan 1, 2014
48.846
-0.063
-0.13%
jan 1, 2015
48.683
-0.163
-0.33%
Ranking of countries by current statistics by years


Comments: