29
/
en
AIzaSyAYiBZKx7MnpbEhh9jyipgxe19OcubqV5w
April 1, 2024
266260
Tonga
TON
true
2
1
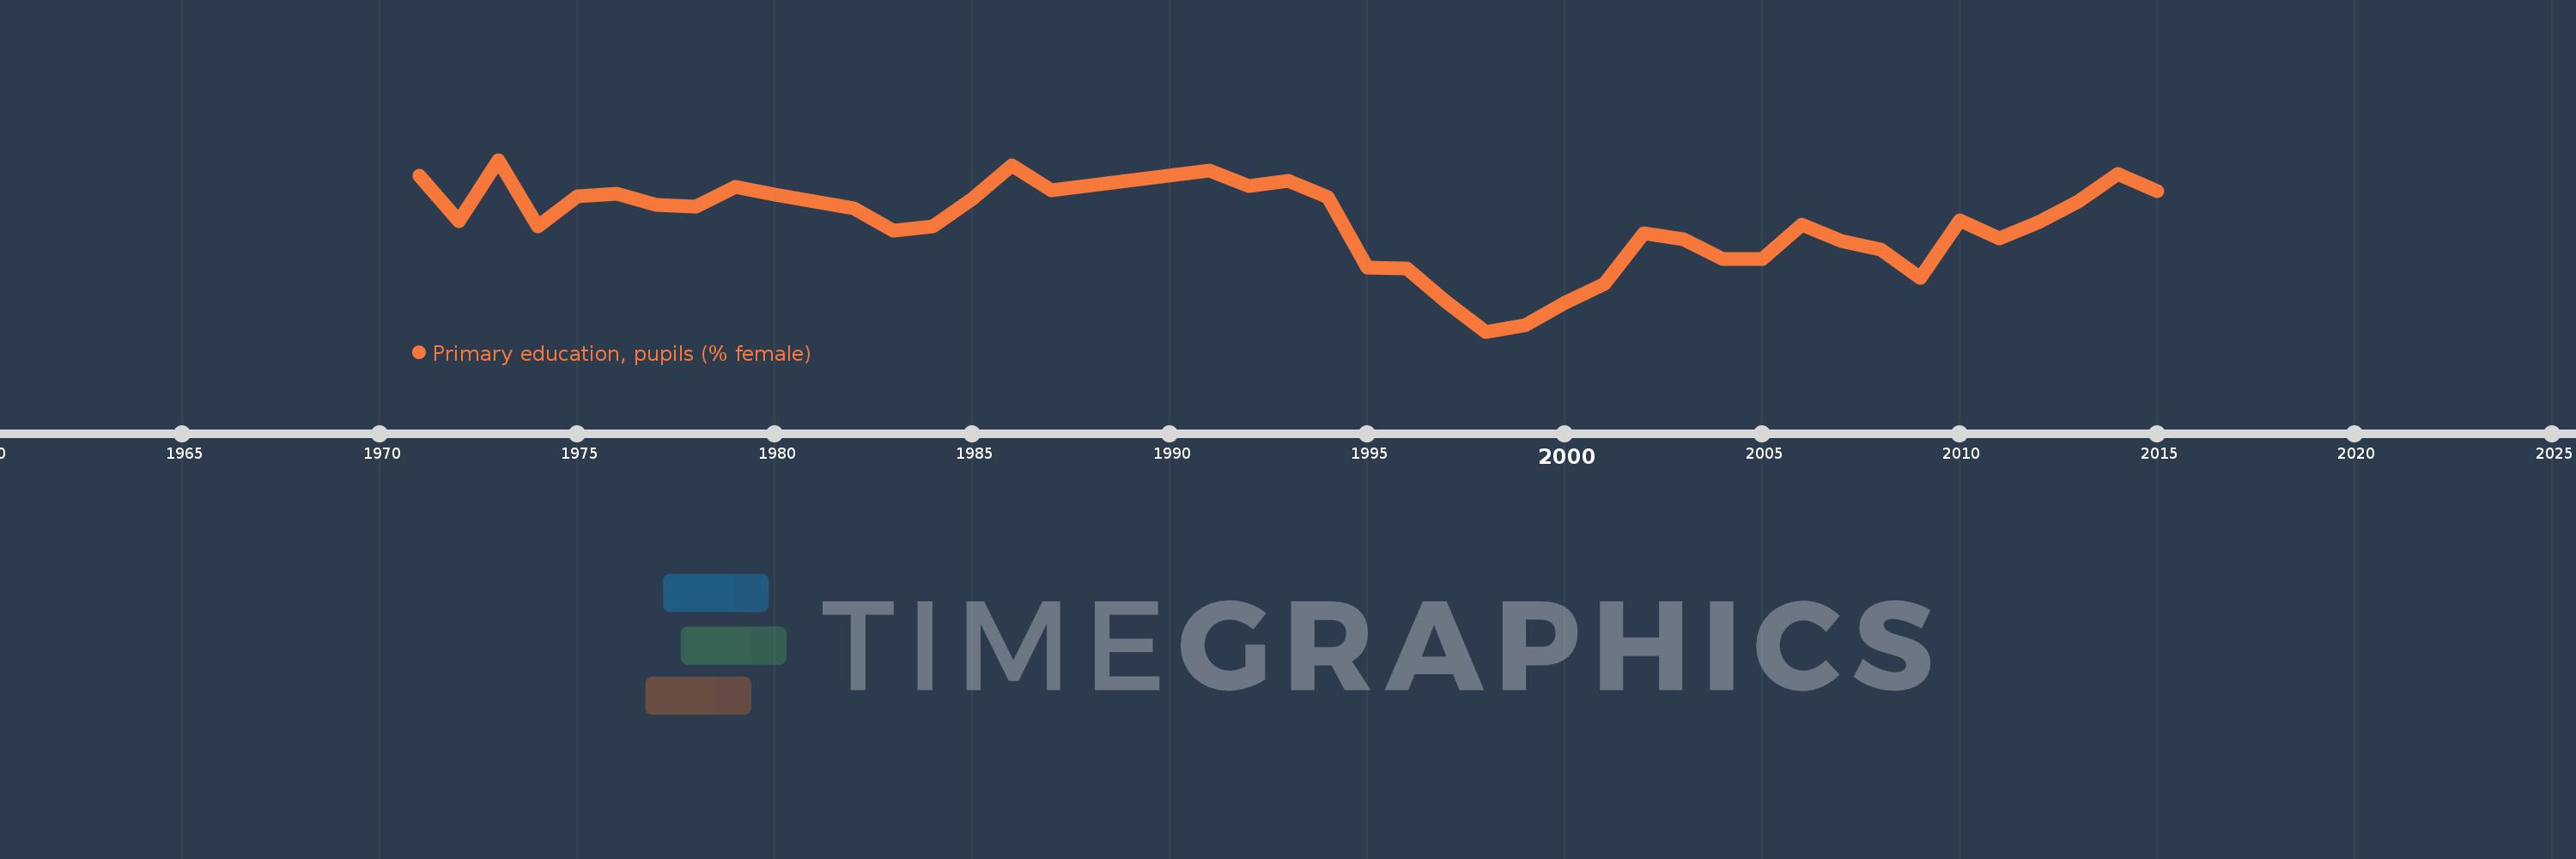
Primary education, pupils (% female)
2015,2014,2013,2012,2011,2010,2009,2008,2007,2006,2005,2004,2003,2002,2001,2000,1999,1998,1997,1996,1995,1994,1993,1992,1991,1987,1986,1985,1984,1983,1982,1980,1979,1978,1977,1976,1975,1974,1973,1972,1971
This statistics in other country:
AfghanistanAlbaniaAlgeriaAndorraAngolaAntigua and BarbudaArab WorldArgentinaArmeniaArubaAustraliaAustriaAzerbaijanBahamas, TheBahrainBangladeshBarbadosBelarusBelgiumBelizeBeninBermudaBhutanBoliviaBosnia and HerzegovinaBotswanaBrazilBritish Virgin IslandsBrunei DarussalamBulgariaBurkina FasoBurundiCabo VerdeCambodiaCameroonCanadaCaribbean small statesCayman IslandsCentral African RepublicCentral Europe and the BalticsChadChileChinaColombiaComorosCongo, Dem. Rep.Congo, Rep.Costa RicaCote d'IvoireCroatiaCubaCuracaoCyprusCzech RepublicDenmarkDjiboutiDominicaDominican RepublicEarly-demographic dividendEast Asia & PacificEast Asia & Pacific (excluding high income)East Asia & Pacific (IDA & IBRD countries)EcuadorEgypt, Arab Rep.El SalvadorEquatorial GuineaEritreaEstoniaEthiopiaEuro areaEurope & Central AsiaEurope & Central Asia (excluding high income)Europe & Central Asia (IDA & IBRD countries)European UnionFijiFinlandFragile and conflict affected situationsFranceGabonGambia, TheGeorgiaGermanyGhanaGibraltarGreeceGrenadaGuatemalaGuineaGuinea-BissauGuyanaHaitiHeavily indebted poor countries (HIPC)High incomeHondurasHong Kong SAR, ChinaHungaryIBRD onlyIcelandIDA & IBRD totalIDA blendIDA onlyIDA totalIndiaIndonesiaIran, Islamic Rep.IraqIrelandIsraelItalyJamaicaJapanJordanKazakhstanKenyaKiribatiKorea, Dem. People’s Rep.Korea, Rep.KuwaitKyrgyz RepublicLao PDRLate-demographic dividendLatin America & Caribbean Latin America & Caribbean (excluding high income)Latin America & the Caribbean (IDA & IBRD countries)LatviaLeast developed countries: UN classificationLebanonLesothoLiberiaLibyaLiechtensteinLithuaniaLow & middle incomeLow incomeLower middle incomeLuxembourgMacao SAR, ChinaMacedonia, FYRMadagascarMalawiMalaysiaMaldivesMaliMaltaMarshall IslandsMauritaniaMauritiusMexicoMicronesia, Fed. Sts.Middle East & North AfricaMiddle East & North Africa (excluding high income)Middle East & North Africa (IDA & IBRD countries)Middle incomeMoldovaMonacoMongoliaMontenegroMoroccoMozambiqueMyanmarNamibiaNauruNepalNetherlandsNew ZealandNicaraguaNigerNigeriaNorth AmericaNorwayOECD membersOmanOther small statesPacific island small statesPakistanPalauPanamaPapua New GuineaParaguayPeruPhilippinesPolandPortugalPost-demographic dividendPre-demographic dividendPuerto RicoQatarRomaniaRussian FederationRwandaSamoaSan MarinoSao Tome and PrincipeSaudi ArabiaSenegalSerbiaSeychellesSierra LeoneSingaporeSint Maarten (Dutch part)Slovak RepublicSloveniaSmall statesSolomon IslandsSomaliaSouth AfricaSouth AsiaSouth Asia (IDA & IBRD)South SudanSpainSri LankaSt. Kitts and NevisSt. LuciaSt. Vincent and the GrenadinesSub-Saharan Africa Sub-Saharan Africa (excluding high income)Sub-Saharan Africa (IDA & IBRD countries)SudanSurinameSwazilandSwedenSwitzerlandSyrian Arab RepublicTajikistanTanzaniaThailandTimor-LesteTogoTongaTrinidad and TobagoTunisiaTurkeyTurkmenistanTurks and Caicos IslandsTuvaluUgandaUkraineUnited Arab EmiratesUnited KingdomUnited StatesUpper middle incomeUruguayUzbekistanVanuatuVenezuela, RBVietnamWest Bank and GazaWorldYemen, Rep.ZambiaZimbabwe Timeline:
This timeline shows a graph from 1971 to 2015 of Tonga. No data until 1970. Number of actual observations by date: 41.
Source name:
World Development Indicators
Source organization:
United Nations Educational, Scientific, and Cultural Organization (UNESCO) Institute for Statistics.
Categories, topics:
Education, Gender
Last updated:
apr 23, 2017
Indicators value changes by year
At the date of observation
Value
Absolute change
Change from previous value
jan 1, 1971
47.848
+47.848
0.0%
jan 1, 1972
47.338
-0.51
-1.07%
jan 1, 1973
48.02
+0.682
1.44%
jan 1, 1974
47.285
-0.735
-1.53%
jan 1, 1975
47.614
+0.329
0.69%
jan 1, 1976
47.643
+0.029
0.06%
jan 1, 1977
47.525
-0.118
-0.25%
jan 1, 1978
47.507
-0.018
-0.04%
jan 1, 1979
47.719
+0.212
0.45%
jan 1, 1980
47.635
-0.084
-0.18%
jan 1, 1982
47.483
-0.151
-0.32%
jan 1, 1983
47.237
-0.247
-0.52%
jan 1, 1984
47.284
+0.047
0.1%
jan 1, 1985
47.586
+0.302
0.64%
jan 1, 1986
47.958
+0.372
0.78%
jan 1, 1987
47.682
-0.276
-0.58%
jan 1, 1991
47.906
+0.224
0.47%
jan 1, 1992
47.734
-0.171
-0.36%
jan 1, 1993
47.785
+0.051
0.11%
jan 1, 1994
47.606
-0.179
-0.37%
jan 1, 1995
46.832
-0.774
-1.63%
jan 1, 1996
46.817
-0.015
-0.03%
jan 1, 1997
46.45
-0.368
-0.79%
jan 1, 1998
46.12
-0.33
-0.71%
jan 1, 1999
46.191
+0.071
0.15%
jan 1, 2000
46.434
+0.243
0.53%
jan 1, 2001
46.643
+0.209
0.45%
jan 1, 2002
47.208
+0.565
1.21%
jan 1, 2003
47.138
-0.07
-0.15%
jan 1, 2004
46.923
-0.215
-0.46%
jan 1, 2005
46.923
+0.0
0.0%
jan 1, 2006
47.299
+0.376
0.8%
jan 1, 2007
47.122
-0.177
-0.37%
jan 1, 2008
47.028
-0.094
-0.2%
jan 1, 2009
46.715
-0.313
-0.67%
jan 1, 2010
47.347
+0.632
1.35%
jan 1, 2011
47.151
-0.196
-0.41%
jan 1, 2012
47.332
+0.181
0.38%
jan 1, 2013
47.561
+0.23
0.49%
jan 1, 2014
47.864
+0.303
0.64%
jan 1, 2015
47.669
-0.195
-0.41%
Ranking of countries by current statistics by years


Comments: