29
/
en
AIzaSyAYiBZKx7MnpbEhh9jyipgxe19OcubqV5w
April 1, 2024
287829
Zimbabwe
ZWE
true
2
1
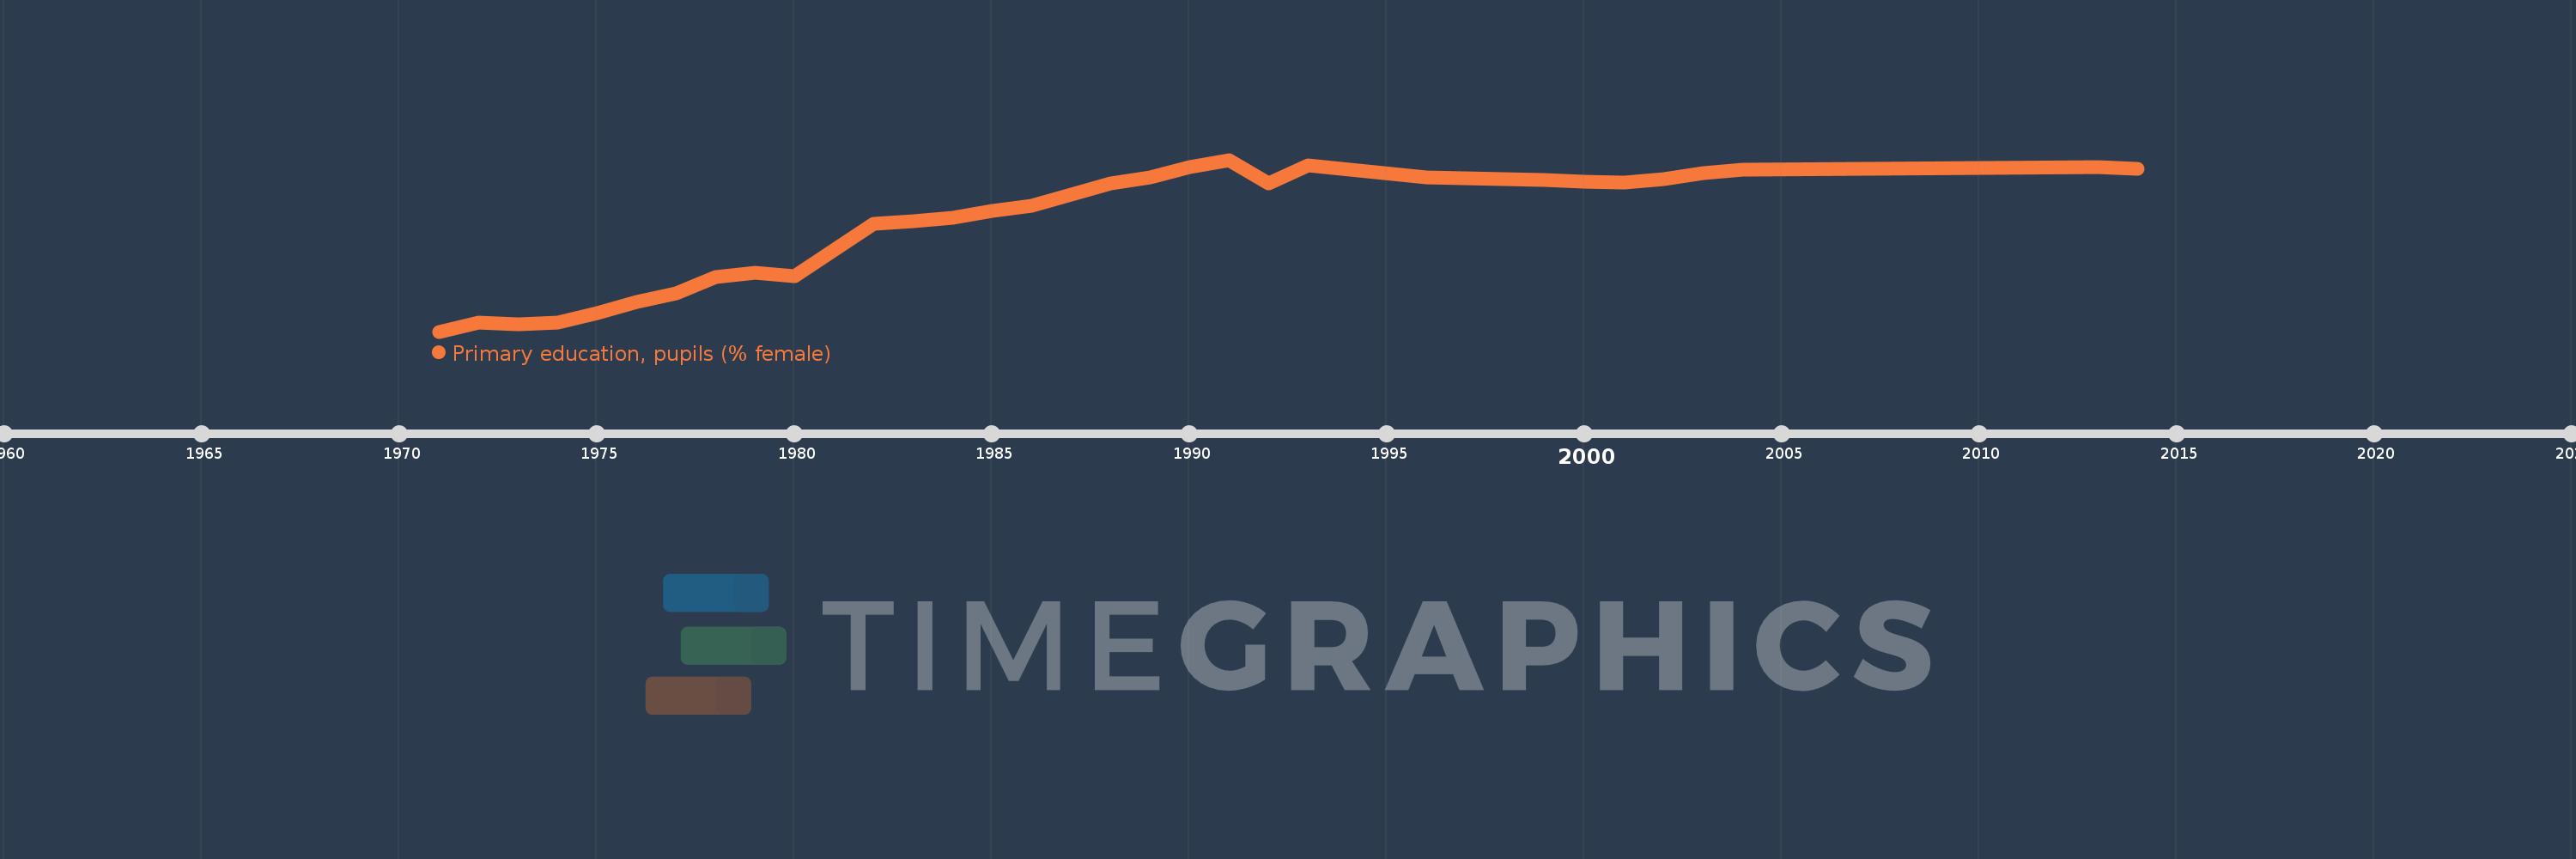
Primary education, pupils (% female)
2014,2013,2004,2003,2002,2001,2000,1999,1997,1996,1993,1992,1991,1990,1989,1988,1987,1986,1985,1984,1983,1982,1980,1979,1978,1977,1976,1975,1974,1973,1972,1971
This statistics in other country:
AfghanistanAlbaniaAlgeriaAndorraAngolaAntigua and BarbudaArab WorldArgentinaArmeniaArubaAustraliaAustriaAzerbaijanBahamas, TheBahrainBangladeshBarbadosBelarusBelgiumBelizeBeninBermudaBhutanBoliviaBosnia and HerzegovinaBotswanaBrazilBritish Virgin IslandsBrunei DarussalamBulgariaBurkina FasoBurundiCabo VerdeCambodiaCameroonCanadaCaribbean small statesCayman IslandsCentral African RepublicCentral Europe and the BalticsChadChileChinaColombiaComorosCongo, Dem. Rep.Congo, Rep.Costa RicaCote d'IvoireCroatiaCubaCuracaoCyprusCzech RepublicDenmarkDjiboutiDominicaDominican RepublicEarly-demographic dividendEast Asia & PacificEast Asia & Pacific (excluding high income)East Asia & Pacific (IDA & IBRD countries)EcuadorEgypt, Arab Rep.El SalvadorEquatorial GuineaEritreaEstoniaEthiopiaEuro areaEurope & Central AsiaEurope & Central Asia (excluding high income)Europe & Central Asia (IDA & IBRD countries)European UnionFijiFinlandFragile and conflict affected situationsFranceGabonGambia, TheGeorgiaGermanyGhanaGibraltarGreeceGrenadaGuatemalaGuineaGuinea-BissauGuyanaHaitiHeavily indebted poor countries (HIPC)High incomeHondurasHong Kong SAR, ChinaHungaryIBRD onlyIcelandIDA & IBRD totalIDA blendIDA onlyIDA totalIndiaIndonesiaIran, Islamic Rep.IraqIrelandIsraelItalyJamaicaJapanJordanKazakhstanKenyaKiribatiKorea, Dem. People’s Rep.Korea, Rep.KuwaitKyrgyz RepublicLao PDRLate-demographic dividendLatin America & Caribbean Latin America & Caribbean (excluding high income)Latin America & the Caribbean (IDA & IBRD countries)LatviaLeast developed countries: UN classificationLebanonLesothoLiberiaLibyaLiechtensteinLithuaniaLow & middle incomeLow incomeLower middle incomeLuxembourgMacao SAR, ChinaMacedonia, FYRMadagascarMalawiMalaysiaMaldivesMaliMaltaMarshall IslandsMauritaniaMauritiusMexicoMicronesia, Fed. Sts.Middle East & North AfricaMiddle East & North Africa (excluding high income)Middle East & North Africa (IDA & IBRD countries)Middle incomeMoldovaMonacoMongoliaMontenegroMoroccoMozambiqueMyanmarNamibiaNauruNepalNetherlandsNew ZealandNicaraguaNigerNigeriaNorth AmericaNorwayOECD membersOmanOther small statesPacific island small statesPakistanPalauPanamaPapua New GuineaParaguayPeruPhilippinesPolandPortugalPost-demographic dividendPre-demographic dividendPuerto RicoQatarRomaniaRussian FederationRwandaSamoaSan MarinoSao Tome and PrincipeSaudi ArabiaSenegalSerbiaSeychellesSierra LeoneSingaporeSint Maarten (Dutch part)Slovak RepublicSloveniaSmall statesSolomon IslandsSomaliaSouth AfricaSouth AsiaSouth Asia (IDA & IBRD)South SudanSpainSri LankaSt. Kitts and NevisSt. LuciaSt. Vincent and the GrenadinesSub-Saharan Africa Sub-Saharan Africa (excluding high income)Sub-Saharan Africa (IDA & IBRD countries)SudanSurinameSwazilandSwedenSwitzerlandSyrian Arab RepublicTajikistanTanzaniaThailandTimor-LesteTogoTongaTrinidad and TobagoTunisiaTurkeyTurkmenistanTurks and Caicos IslandsTuvaluUgandaUkraineUnited Arab EmiratesUnited KingdomUnited StatesUpper middle incomeUruguayUzbekistanVanuatuVenezuela, RBVietnamWest Bank and GazaWorldYemen, Rep.ZambiaZimbabwe Timeline:
This timeline shows a graph from 1971 to 2014 of Zimbabwe. No data until 1970. Number of actual observations by date: 32.
Source name:
World Development Indicators
Source organization:
United Nations Educational, Scientific, and Cultural Organization (UNESCO) Institute for Statistics.
Categories, topics:
Education, Gender
Last updated:
apr 23, 2017
Indicators value changes by year
Minimum:
44.976
jan 1, 1971
Maximum:
49.748
jan 1, 1991
At the date of observation
Value
Absolute change
Change from previous value
jan 1, 1971
44.976
+44.976
0.0%
jan 1, 1972
45.215
+0.239
0.53%
jan 1, 1973
45.169
-0.046
-0.1%
jan 1, 1974
45.236
+0.066
0.15%
jan 1, 1975
45.483
+0.247
0.55%
jan 1, 1976
45.798
+0.315
0.69%
jan 1, 1977
46.038
+0.24
0.52%
jan 1, 1978
46.489
+0.451
0.98%
jan 1, 1979
46.617
+0.129
0.28%
jan 1, 1980
46.514
-0.103
-0.22%
jan 1, 1982
47.96
+1.446
3.11%
jan 1, 1983
48.04
+0.08
0.17%
jan 1, 1984
48.149
+0.109
0.23%
jan 1, 1985
48.331
+0.182
0.38%
jan 1, 1986
48.473
+0.142
0.29%
jan 1, 1987
48.789
+0.316
0.65%
jan 1, 1988
49.087
+0.298
0.61%
jan 1, 1989
49.264
+0.177
0.36%
jan 1, 1990
49.55
+0.286
0.58%
jan 1, 1991
49.748
+0.198
0.4%
jan 1, 1992
49.103
-0.645
-1.3%
jan 1, 1993
49.597
+0.495
1.01%
jan 1, 1996
49.252
-0.345
-0.7%
jan 1, 1997
49.238
-0.014
-0.03%
jan 1, 1999
49.199
-0.039
-0.08%
jan 1, 2000
49.131
-0.067
-0.14%
jan 1, 2001
49.123
-0.009
-0.02%
jan 1, 2002
49.206
+0.083
0.17%
jan 1, 2003
49.381
+0.175
0.36%
jan 1, 2004
49.479
+0.098
0.2%
jan 1, 2013
49.557
+0.078
0.16%
jan 1, 2014
49.503
-0.053
-0.11%
Ranking of countries by current statistics by years


Comments: