29
/
en
AIzaSyAYiBZKx7MnpbEhh9jyipgxe19OcubqV5w
April 1, 2024
87868
Bolivia
BOL
true
2
1
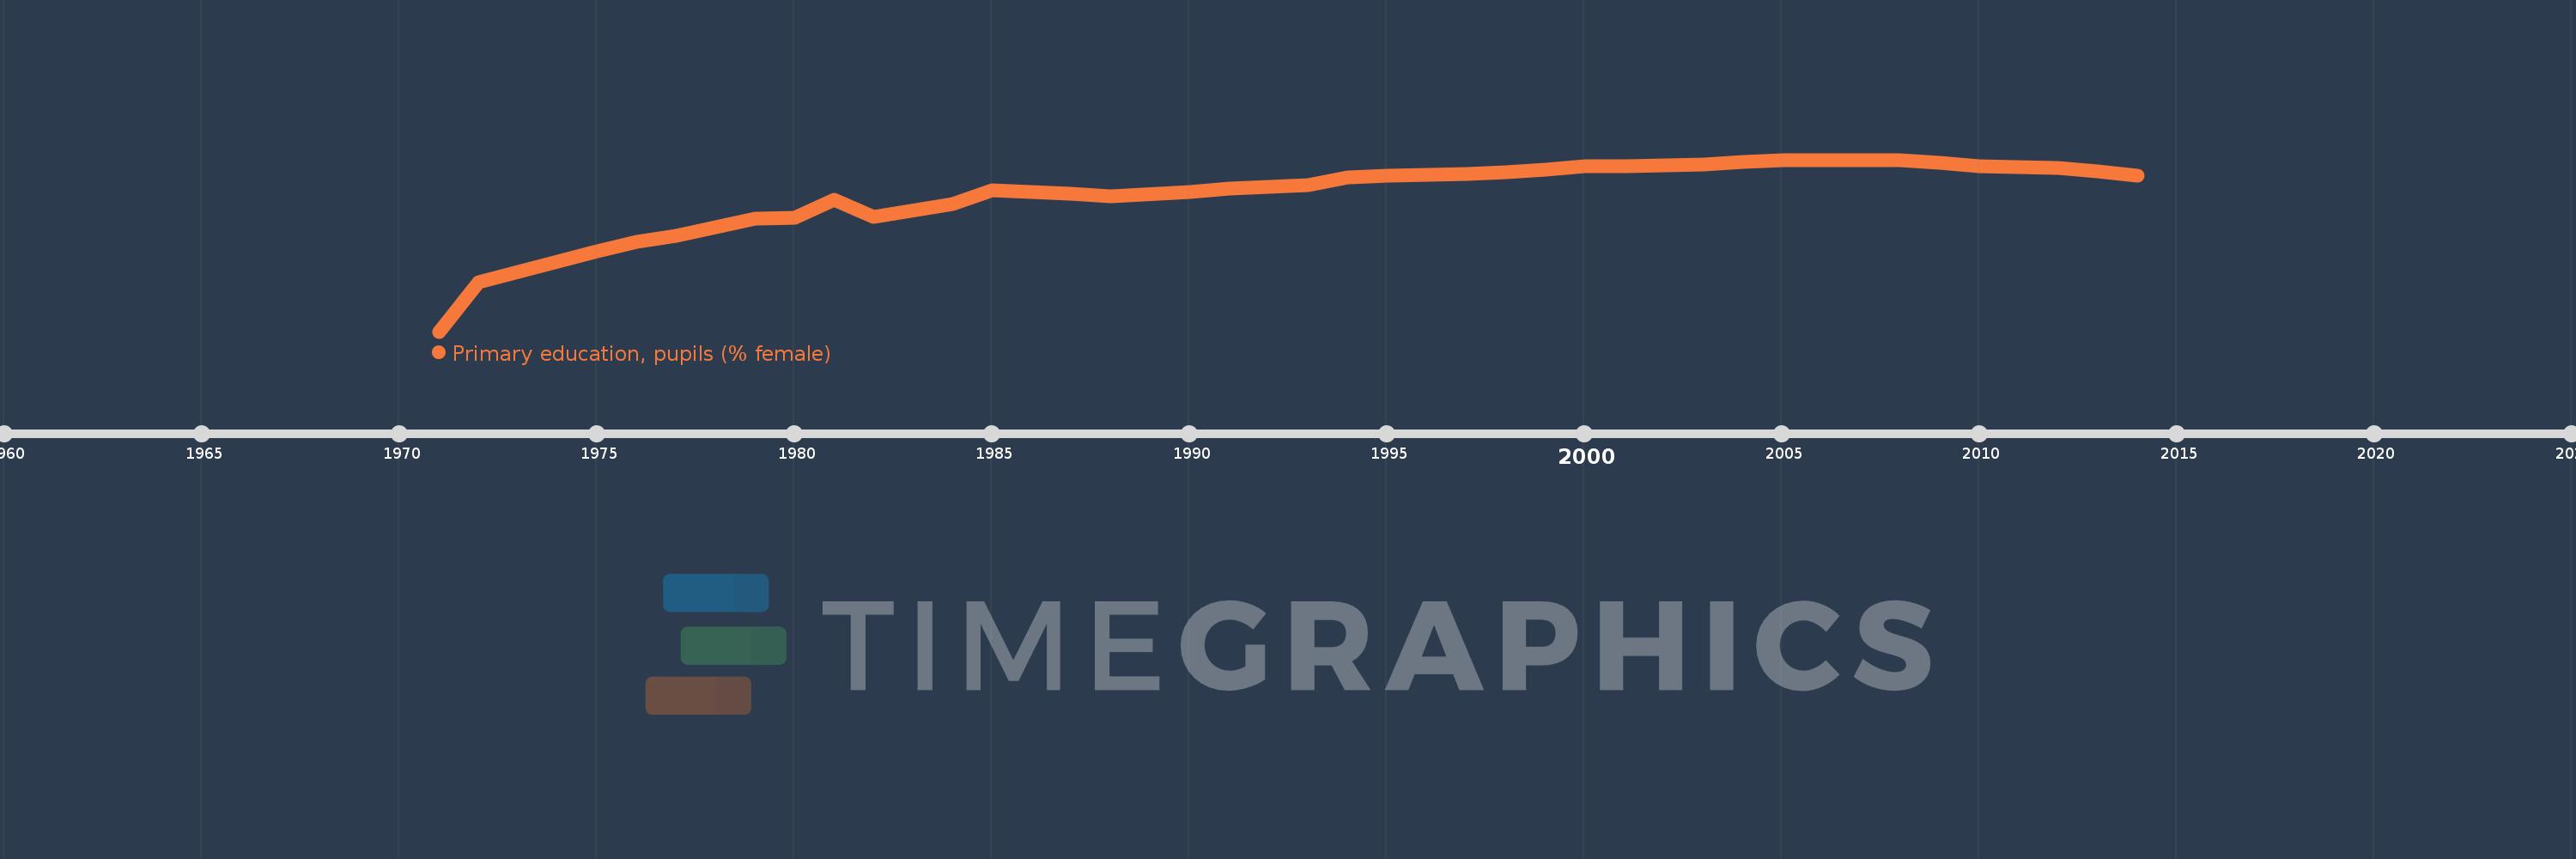
Primary education, pupils (% female)
2014,2013,2012,2011,2010,2009,2008,2007,2005,2004,2003,2002,2001,2000,1999,1998,1997,1996,1995,1994,1993,1992,1991,1990,1988,1987,1985,1984,1982,1981,1980,1979,1978,1977,1976,1975,1974,1972,1971
This statistics in other country:
AfghanistanAlbaniaAlgeriaAndorraAngolaAntigua and BarbudaArab WorldArgentinaArmeniaArubaAustraliaAustriaAzerbaijanBahamas, TheBahrainBangladeshBarbadosBelarusBelgiumBelizeBeninBermudaBhutanBoliviaBosnia and HerzegovinaBotswanaBrazilBritish Virgin IslandsBrunei DarussalamBulgariaBurkina FasoBurundiCabo VerdeCambodiaCameroonCanadaCaribbean small statesCayman IslandsCentral African RepublicCentral Europe and the BalticsChadChileChinaColombiaComorosCongo, Dem. Rep.Congo, Rep.Costa RicaCote d'IvoireCroatiaCubaCuracaoCyprusCzech RepublicDenmarkDjiboutiDominicaDominican RepublicEarly-demographic dividendEast Asia & PacificEast Asia & Pacific (excluding high income)East Asia & Pacific (IDA & IBRD countries)EcuadorEgypt, Arab Rep.El SalvadorEquatorial GuineaEritreaEstoniaEthiopiaEuro areaEurope & Central AsiaEurope & Central Asia (excluding high income)Europe & Central Asia (IDA & IBRD countries)European UnionFijiFinlandFragile and conflict affected situationsFranceGabonGambia, TheGeorgiaGermanyGhanaGibraltarGreeceGrenadaGuatemalaGuineaGuinea-BissauGuyanaHaitiHeavily indebted poor countries (HIPC)High incomeHondurasHong Kong SAR, ChinaHungaryIBRD onlyIcelandIDA & IBRD totalIDA blendIDA onlyIDA totalIndiaIndonesiaIran, Islamic Rep.IraqIrelandIsraelItalyJamaicaJapanJordanKazakhstanKenyaKiribatiKorea, Dem. People’s Rep.Korea, Rep.KuwaitKyrgyz RepublicLao PDRLate-demographic dividendLatin America & Caribbean Latin America & Caribbean (excluding high income)Latin America & the Caribbean (IDA & IBRD countries)LatviaLeast developed countries: UN classificationLebanonLesothoLiberiaLibyaLiechtensteinLithuaniaLow & middle incomeLow incomeLower middle incomeLuxembourgMacao SAR, ChinaMacedonia, FYRMadagascarMalawiMalaysiaMaldivesMaliMaltaMarshall IslandsMauritaniaMauritiusMexicoMicronesia, Fed. Sts.Middle East & North AfricaMiddle East & North Africa (excluding high income)Middle East & North Africa (IDA & IBRD countries)Middle incomeMoldovaMonacoMongoliaMontenegroMoroccoMozambiqueMyanmarNamibiaNauruNepalNetherlandsNew ZealandNicaraguaNigerNigeriaNorth AmericaNorwayOECD membersOmanOther small statesPacific island small statesPakistanPalauPanamaPapua New GuineaParaguayPeruPhilippinesPolandPortugalPost-demographic dividendPre-demographic dividendPuerto RicoQatarRomaniaRussian FederationRwandaSamoaSan MarinoSao Tome and PrincipeSaudi ArabiaSenegalSerbiaSeychellesSierra LeoneSingaporeSint Maarten (Dutch part)Slovak RepublicSloveniaSmall statesSolomon IslandsSomaliaSouth AfricaSouth AsiaSouth Asia (IDA & IBRD)South SudanSpainSri LankaSt. Kitts and NevisSt. LuciaSt. Vincent and the GrenadinesSub-Saharan Africa Sub-Saharan Africa (excluding high income)Sub-Saharan Africa (IDA & IBRD countries)SudanSurinameSwazilandSwedenSwitzerlandSyrian Arab RepublicTajikistanTanzaniaThailandTimor-LesteTogoTongaTrinidad and TobagoTunisiaTurkeyTurkmenistanTurks and Caicos IslandsTuvaluUgandaUkraineUnited Arab EmiratesUnited KingdomUnited StatesUpper middle incomeUruguayUzbekistanVanuatuVenezuela, RBVietnamWest Bank and GazaWorldYemen, Rep.ZambiaZimbabwe Timeline:
This timeline shows a graph from 1971 to 2014 of Bolivia. No data until 1970. Number of actual observations by date: 39.
Source name:
World Development Indicators
Source organization:
United Nations Educational, Scientific, and Cultural Organization (UNESCO) Institute for Statistics.
Categories, topics:
Education, Gender
Last updated:
apr 23, 2017
Indicators value changes by year
Minimum:
40.995
jan 1, 1971
Maximum:
49.011
jan 1, 2007
At the date of observation
Value
Absolute change
Change from previous value
jan 1, 1971
40.995
+40.995
0.0%
jan 1, 1972
43.288
+2.293
5.59%
jan 1, 1974
44.274
+0.987
2.28%
jan 1, 1975
44.752
+0.477
1.08%
jan 1, 1976
45.168
+0.417
0.93%
jan 1, 1977
45.458
+0.289
0.64%
jan 1, 1978
45.856
+0.398
0.88%
jan 1, 1979
46.26
+0.404
0.88%
jan 1, 1980
46.3
+0.04
0.09%
jan 1, 1981
47.164
+0.864
1.87%
jan 1, 1982
46.341
-0.823
-1.74%
jan 1, 1984
46.964
+0.623
1.34%
jan 1, 1985
47.604
+0.64
1.36%
jan 1, 1987
47.44
-0.164
-0.34%
jan 1, 1988
47.315
-0.124
-0.26%
jan 1, 1990
47.516
+0.2
0.42%
jan 1, 1991
47.649
+0.134
0.28%
jan 1, 1992
47.732
+0.083
0.17%
jan 1, 1993
47.82
+0.088
0.18%
jan 1, 1994
48.19
+0.371
0.77%
jan 1, 1995
48.283
+0.092
0.19%
jan 1, 1996
48.32
+0.038
0.08%
jan 1, 1997
48.369
+0.049
0.1%
jan 1, 1998
48.416
+0.046
0.1%
jan 1, 1999
48.567
+0.151
0.31%
jan 1, 2000
48.693
+0.126
0.26%
jan 1, 2001
48.729
+0.036
0.07%
jan 1, 2002
48.759
+0.03
0.06%
jan 1, 2003
48.791
+0.032
0.07%
jan 1, 2004
48.904
+0.113
0.23%
jan 1, 2005
48.982
+0.077
0.16%
jan 1, 2007
49.011
+0.03
0.06%
jan 1, 2008
48.977
-0.034
-0.07%
jan 1, 2009
48.865
-0.113
-0.23%
jan 1, 2010
48.725
-0.14
-0.29%
jan 1, 2011
48.68
-0.045
-0.09%
jan 1, 2012
48.632
-0.048
-0.1%
jan 1, 2013
48.466
-0.166
-0.34%
jan 1, 2014
48.27
-0.196
-0.4%
Ranking of countries by current statistics by years


Comments: