29
/
en
AIzaSyAYiBZKx7MnpbEhh9jyipgxe19OcubqV5w
April 1, 2024
70425
Argentina
ARG
true
2
1
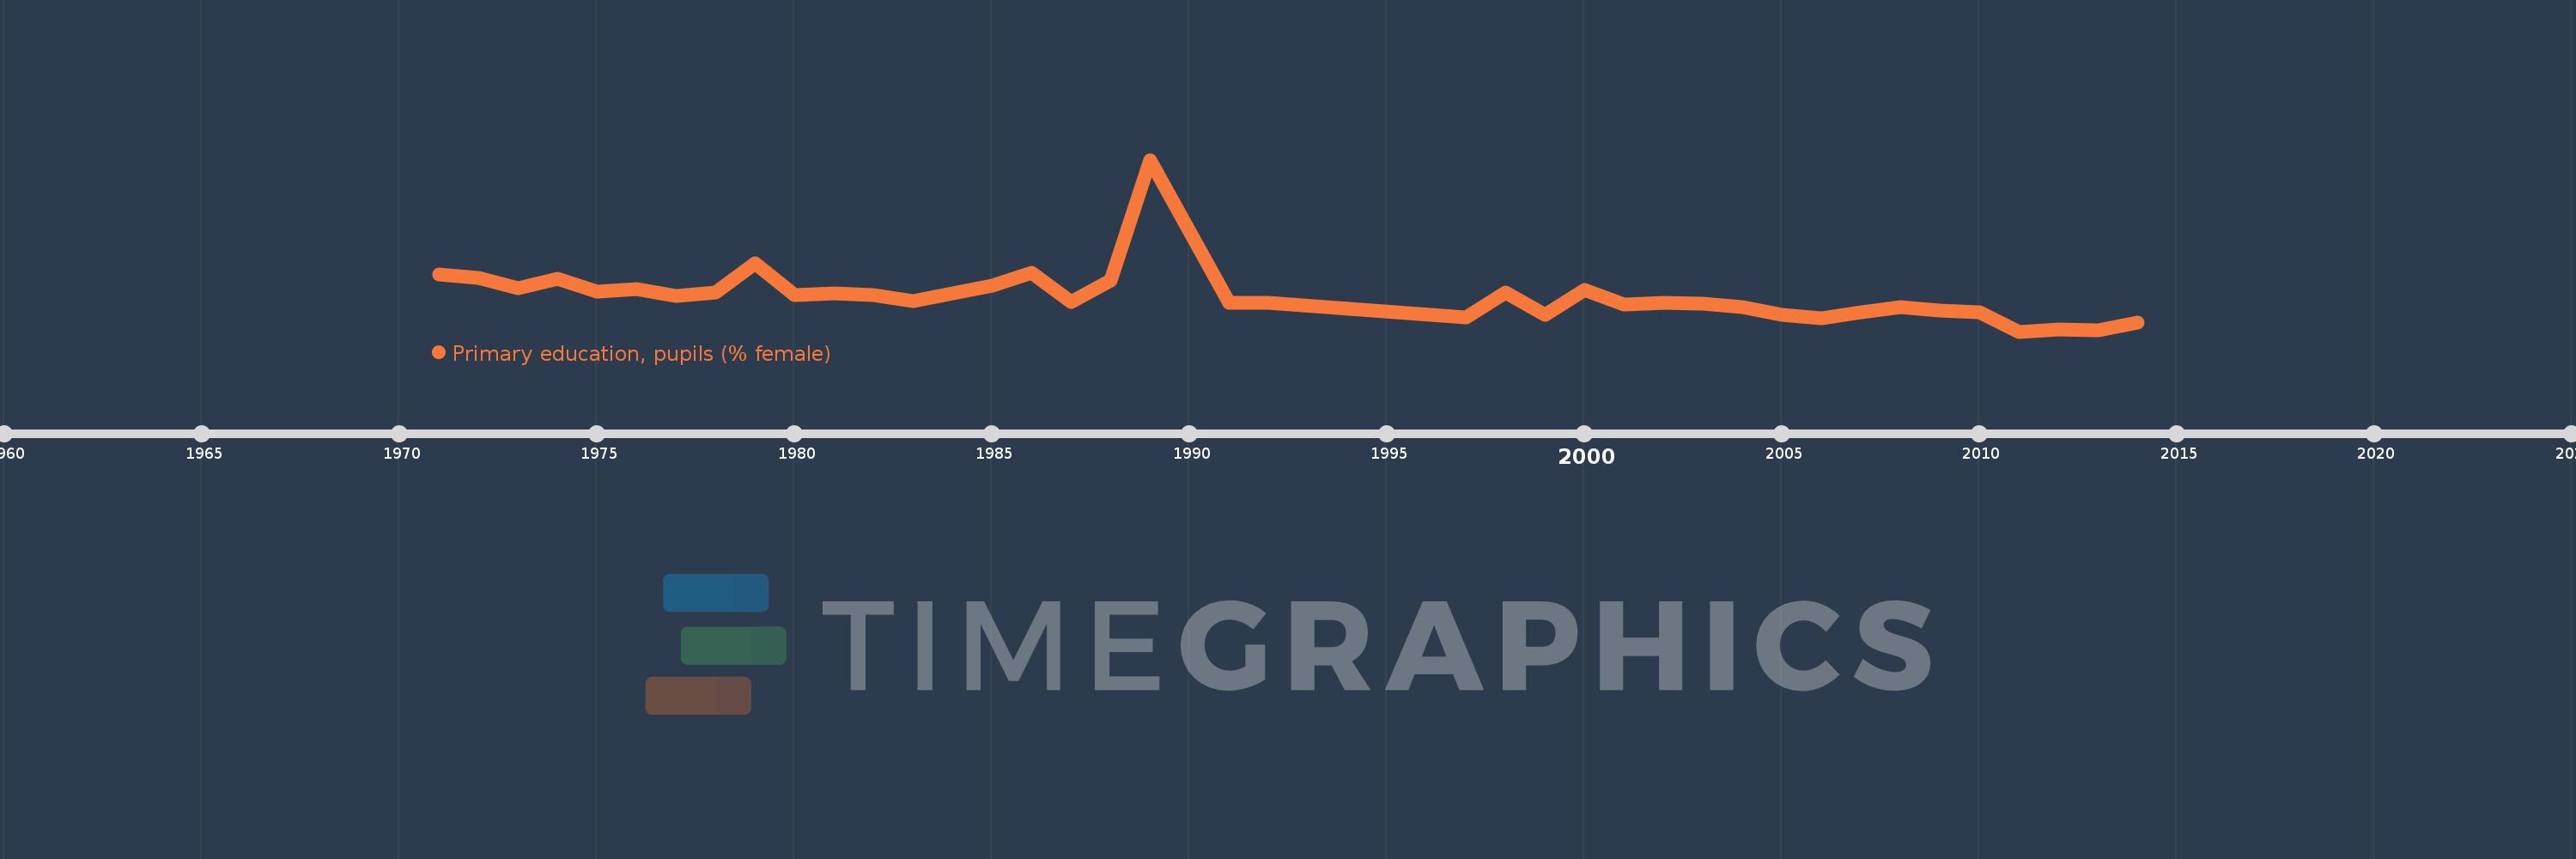
Primary education, pupils (% female)
2014,2013,2012,2011,2010,2009,2008,2007,2006,2005,2004,2003,2002,2001,2000,1999,1998,1997,1992,1991,1989,1988,1987,1986,1985,1983,1982,1981,1980,1979,1978,1977,1976,1975,1974,1973,1972,1971
This statistics in other country:
AfghanistanAlbaniaAlgeriaAndorraAngolaAntigua and BarbudaArab WorldArgentinaArmeniaArubaAustraliaAustriaAzerbaijanBahamas, TheBahrainBangladeshBarbadosBelarusBelgiumBelizeBeninBermudaBhutanBoliviaBosnia and HerzegovinaBotswanaBrazilBritish Virgin IslandsBrunei DarussalamBulgariaBurkina FasoBurundiCabo VerdeCambodiaCameroonCanadaCaribbean small statesCayman IslandsCentral African RepublicCentral Europe and the BalticsChadChileChinaColombiaComorosCongo, Dem. Rep.Congo, Rep.Costa RicaCote d'IvoireCroatiaCubaCuracaoCyprusCzech RepublicDenmarkDjiboutiDominicaDominican RepublicEarly-demographic dividendEast Asia & PacificEast Asia & Pacific (excluding high income)East Asia & Pacific (IDA & IBRD countries)EcuadorEgypt, Arab Rep.El SalvadorEquatorial GuineaEritreaEstoniaEthiopiaEuro areaEurope & Central AsiaEurope & Central Asia (excluding high income)Europe & Central Asia (IDA & IBRD countries)European UnionFijiFinlandFragile and conflict affected situationsFranceGabonGambia, TheGeorgiaGermanyGhanaGibraltarGreeceGrenadaGuatemalaGuineaGuinea-BissauGuyanaHaitiHeavily indebted poor countries (HIPC)High incomeHondurasHong Kong SAR, ChinaHungaryIBRD onlyIcelandIDA & IBRD totalIDA blendIDA onlyIDA totalIndiaIndonesiaIran, Islamic Rep.IraqIrelandIsraelItalyJamaicaJapanJordanKazakhstanKenyaKiribatiKorea, Dem. People’s Rep.Korea, Rep.KuwaitKyrgyz RepublicLao PDRLate-demographic dividendLatin America & Caribbean Latin America & Caribbean (excluding high income)Latin America & the Caribbean (IDA & IBRD countries)LatviaLeast developed countries: UN classificationLebanonLesothoLiberiaLibyaLiechtensteinLithuaniaLow & middle incomeLow incomeLower middle incomeLuxembourgMacao SAR, ChinaMacedonia, FYRMadagascarMalawiMalaysiaMaldivesMaliMaltaMarshall IslandsMauritaniaMauritiusMexicoMicronesia, Fed. Sts.Middle East & North AfricaMiddle East & North Africa (excluding high income)Middle East & North Africa (IDA & IBRD countries)Middle incomeMoldovaMonacoMongoliaMontenegroMoroccoMozambiqueMyanmarNamibiaNauruNepalNetherlandsNew ZealandNicaraguaNigerNigeriaNorth AmericaNorwayOECD membersOmanOther small statesPacific island small statesPakistanPalauPanamaPapua New GuineaParaguayPeruPhilippinesPolandPortugalPost-demographic dividendPre-demographic dividendPuerto RicoQatarRomaniaRussian FederationRwandaSamoaSan MarinoSao Tome and PrincipeSaudi ArabiaSenegalSerbiaSeychellesSierra LeoneSingaporeSint Maarten (Dutch part)Slovak RepublicSloveniaSmall statesSolomon IslandsSomaliaSouth AfricaSouth AsiaSouth Asia (IDA & IBRD)South SudanSpainSri LankaSt. Kitts and NevisSt. LuciaSt. Vincent and the GrenadinesSub-Saharan Africa Sub-Saharan Africa (excluding high income)Sub-Saharan Africa (IDA & IBRD countries)SudanSurinameSwazilandSwedenSwitzerlandSyrian Arab RepublicTajikistanTanzaniaThailandTimor-LesteTogoTongaTrinidad and TobagoTunisiaTurkeyTurkmenistanTurks and Caicos IslandsTuvaluUgandaUkraineUnited Arab EmiratesUnited KingdomUnited StatesUpper middle incomeUruguayUzbekistanVanuatuVenezuela, RBVietnamWest Bank and GazaWorldYemen, Rep.ZambiaZimbabwe Timeline:
This timeline shows a graph from 1971 to 2014 of Argentina. No data until 1970. Number of actual observations by date: 38.
Source name:
World Development Indicators
Source organization:
United Nations Educational, Scientific, and Cultural Organization (UNESCO) Institute for Statistics.
Categories, topics:
Education, Gender
Last updated:
apr 23, 2017
Indicators value changes by year
Minimum:
48.792
jan 1, 2011
Maximum:
50.631
jan 1, 1989
At the date of observation
Value
Absolute change
Change from previous value
jan 1, 1971
49.404
+49.404
0.0%
jan 1, 1972
49.371
-0.033
-0.07%
jan 1, 1973
49.255
-0.117
-0.24%
jan 1, 1974
49.353
+0.099
0.2%
jan 1, 1975
49.222
-0.131
-0.27%
jan 1, 1976
49.248
+0.026
0.05%
jan 1, 1977
49.176
-0.071
-0.15%
jan 1, 1978
49.209
+0.032
0.07%
jan 1, 1979
49.523
+0.314
0.64%
jan 1, 1980
49.186
-0.337
-0.68%
jan 1, 1981
49.2
+0.014
0.03%
jan 1, 1982
49.181
-0.019
-0.04%
jan 1, 1983
49.115
-0.066
-0.13%
jan 1, 1985
49.284
+0.169
0.34%
jan 1, 1986
49.424
+0.14
0.28%
jan 1, 1987
49.112
-0.312
-0.63%
jan 1, 1988
49.343
+0.231
0.47%
jan 1, 1989
50.631
+1.287
2.61%
jan 1, 1991
49.098
-1.533
-3.03%
jan 1, 1992
49.096
-0.002
0.0%
jan 1, 1997
48.944
-0.152
-0.31%
jan 1, 1998
49.214
+0.27
0.55%
jan 1, 1999
48.974
-0.24
-0.49%
jan 1, 2000
49.242
+0.268
0.55%
jan 1, 2001
49.085
-0.157
-0.32%
jan 1, 2002
49.098
+0.013
0.03%
jan 1, 2003
49.089
-0.009
-0.02%
jan 1, 2004
49.05
-0.039
-0.08%
jan 1, 2005
48.973
-0.078
-0.16%
jan 1, 2006
48.93
-0.043
-0.09%
jan 1, 2007
48.997
+0.067
0.14%
jan 1, 2008
49.055
+0.058
0.12%
jan 1, 2009
49.017
-0.038
-0.08%
jan 1, 2010
48.999
-0.019
-0.04%
jan 1, 2011
48.792
-0.207
-0.42%
jan 1, 2012
48.812
+0.02
0.04%
jan 1, 2013
48.81
-0.002
0.0%
jan 1, 2014
48.891
+0.082
0.17%
Ranking of countries by current statistics by years


Comments: